ELK搭建开源日志系统(window版本)—图文详细
日志对于排查错误非常重要,使用linux命令awk sed grep find等命令查询日志非常麻烦,而且很难做数据分析,使用免费开源的ELK可以支撑大规模的日志检索,本文将一步步教怎么快速搭建一个window版本的ELK日志收集系统。
下载elasticsearch、logstash、kibana、filebeat
注意同一系列的版本要一样,防止出现版本不兼容问题,本文使用7.16.0版本,在window系统演示
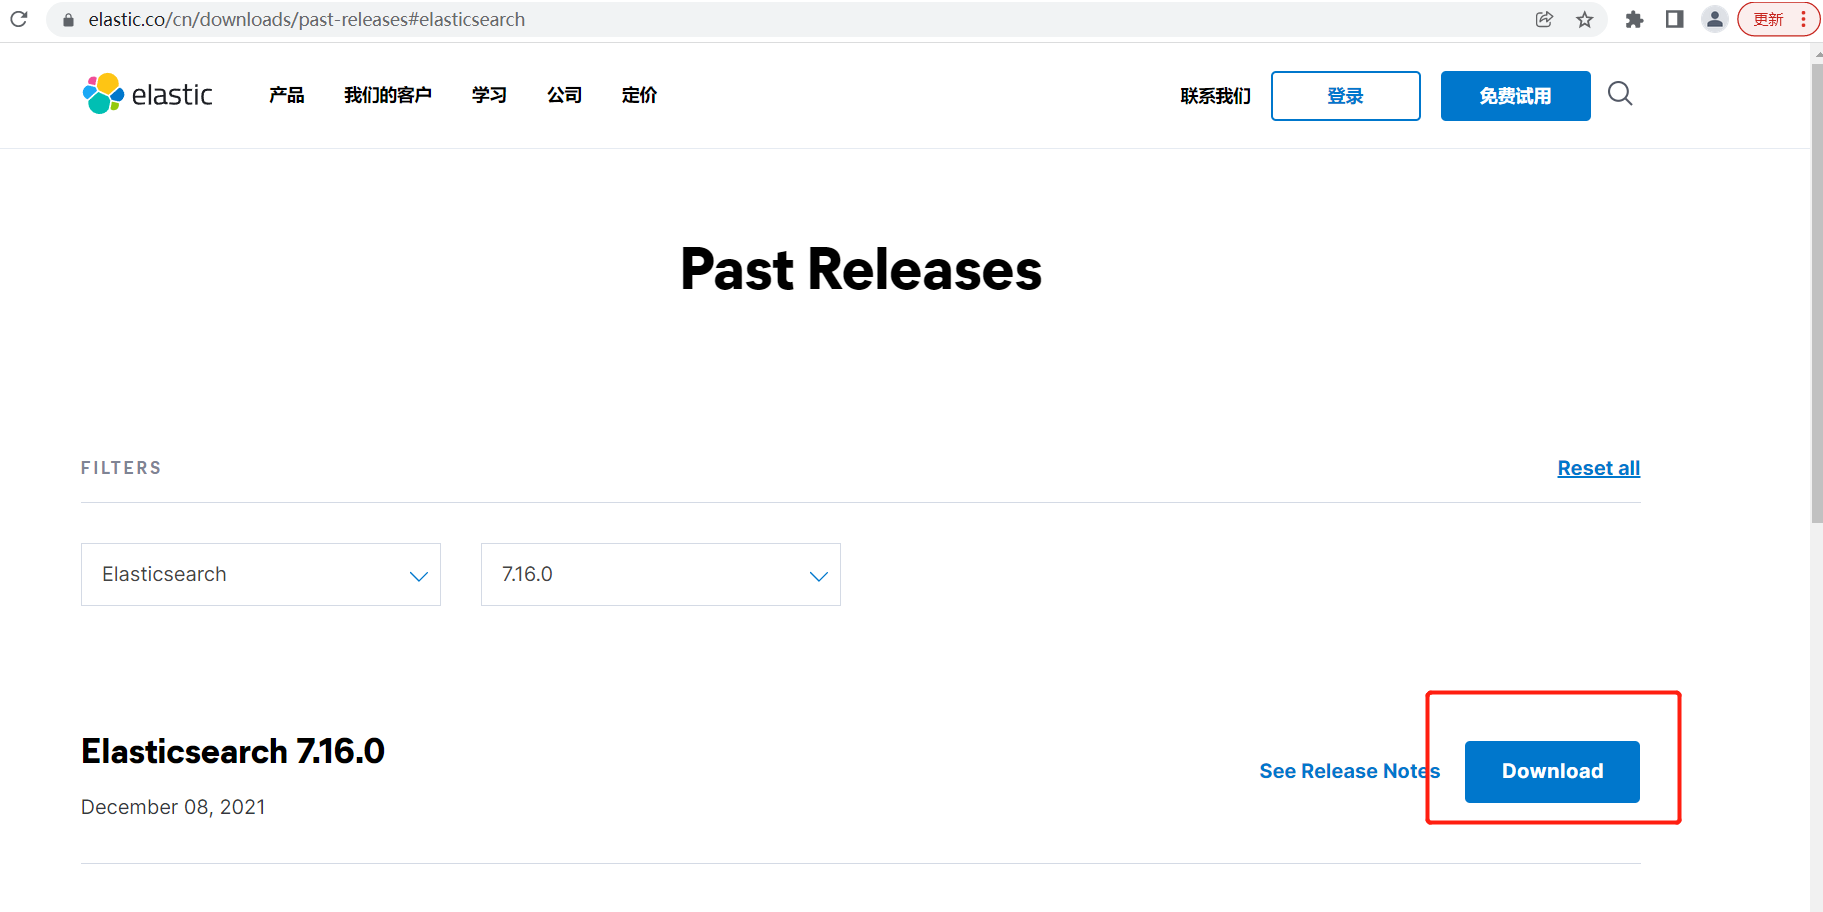
下载elasticsearch
访问地址为:https://www.elastic.co/cn/downloads/past-releases
点击Donload下载
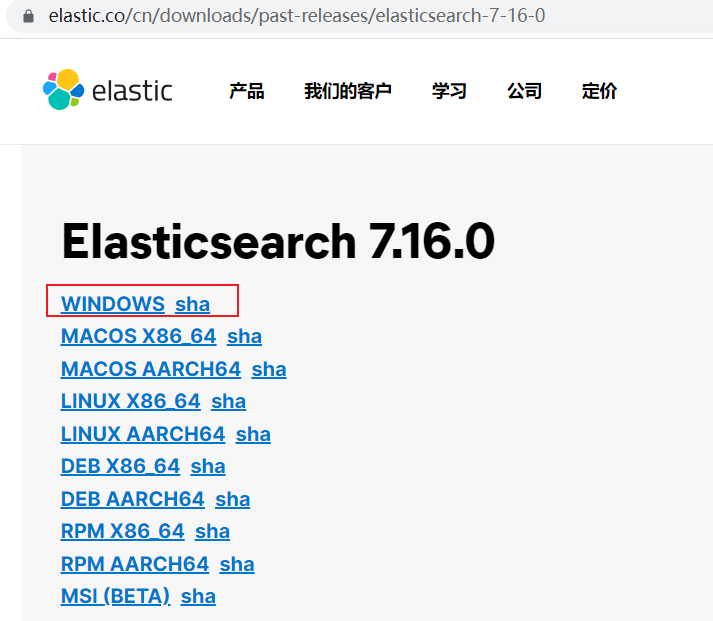
跳转到访问地址为: https://www.elastic.co/cn/downloads/past-releases/elasticsearch-7-16-0
可以选择window或者linux版本,本文下载window版本
下载logstash
点击Donload下载
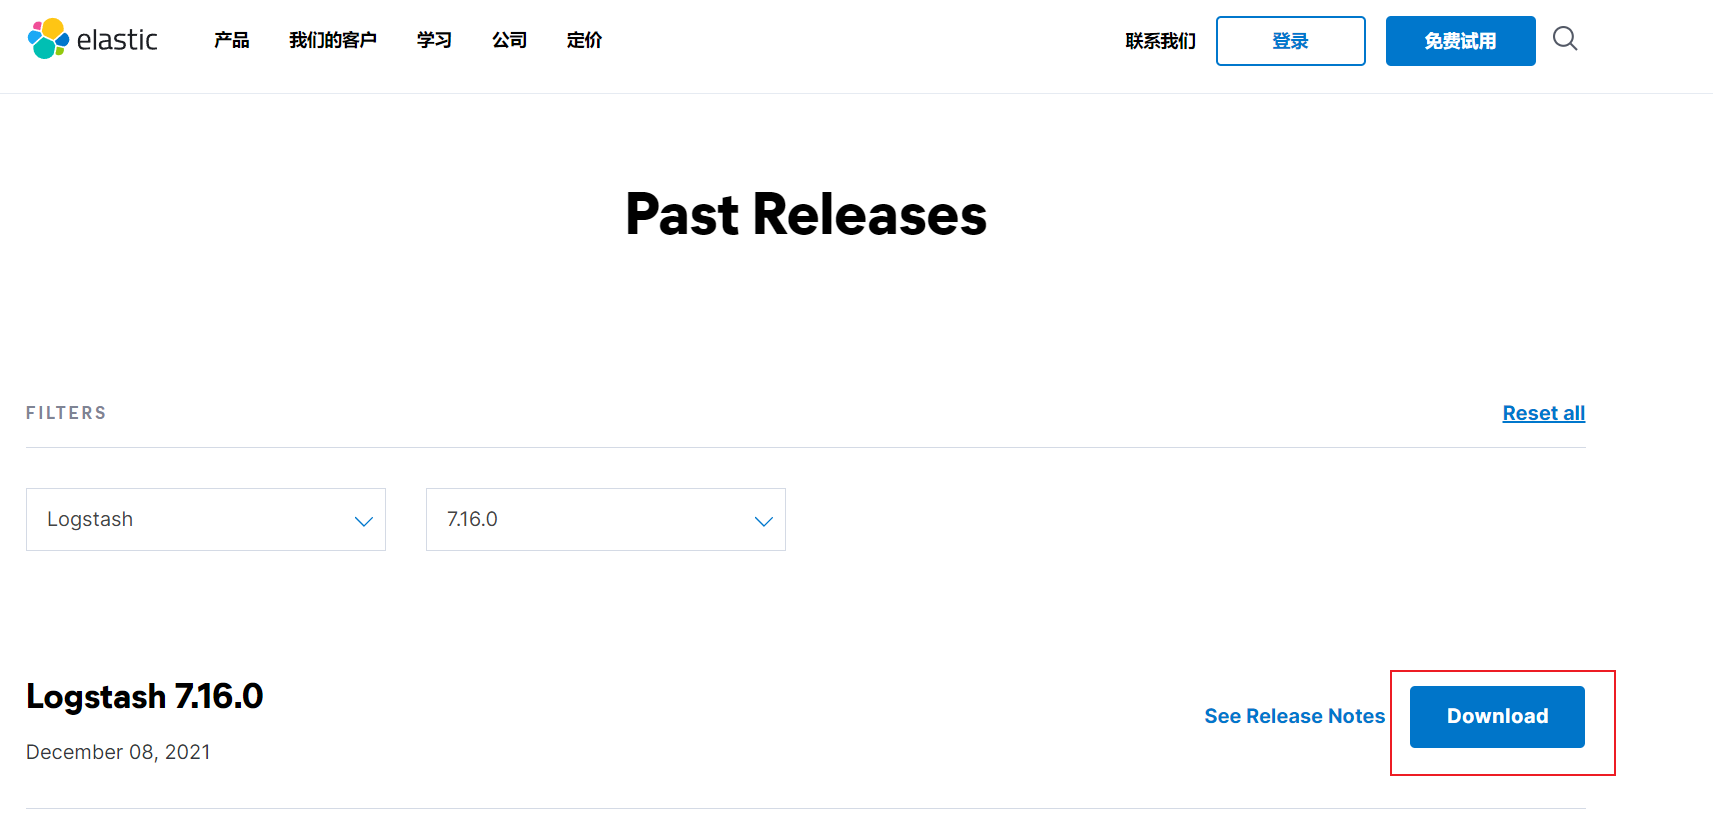
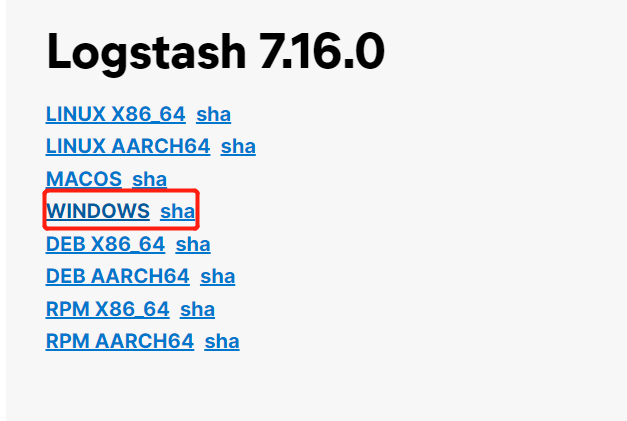
跳转到访问地址为: https://www.elastic.co/cn/downloads/past-releases/logstash-7-16-0
选择window版本
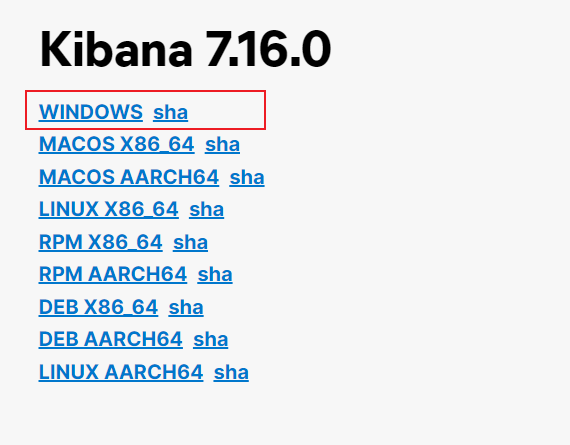
下载kibana
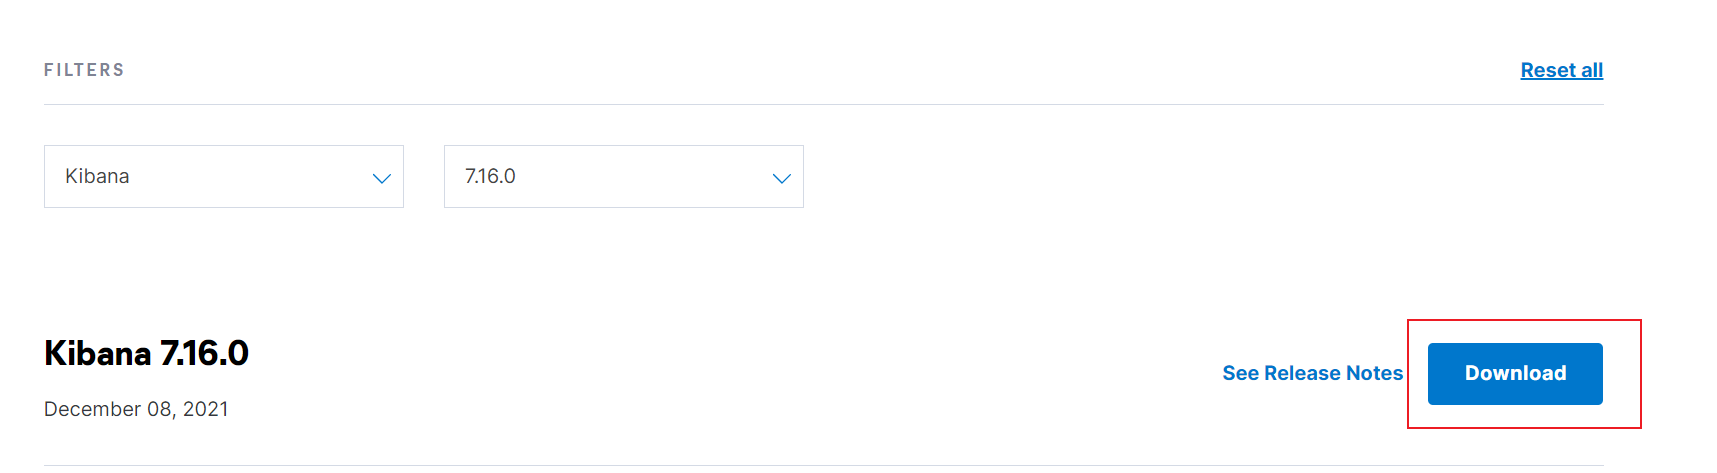
访问地址为:https://www.elastic.co/cn/downloads/past-releases/kibana-7-16-0
选择window版本
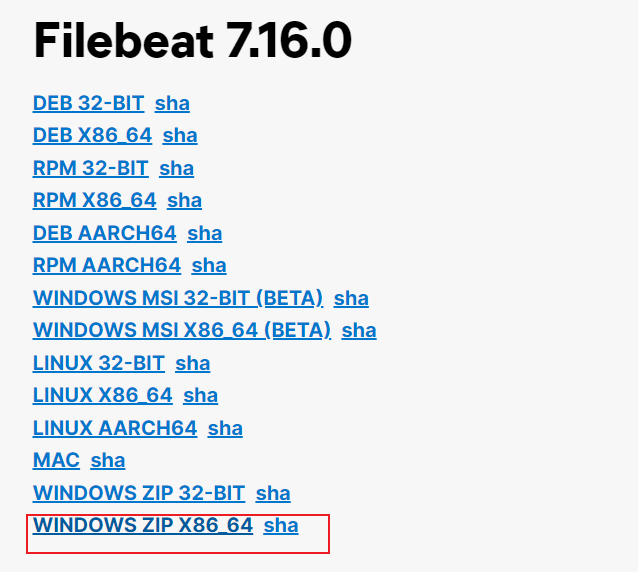
跳转到访问地址为:https://www.elastic.co/cn/downloads/past-releases/filebeat-7-16-0
下载filebeat
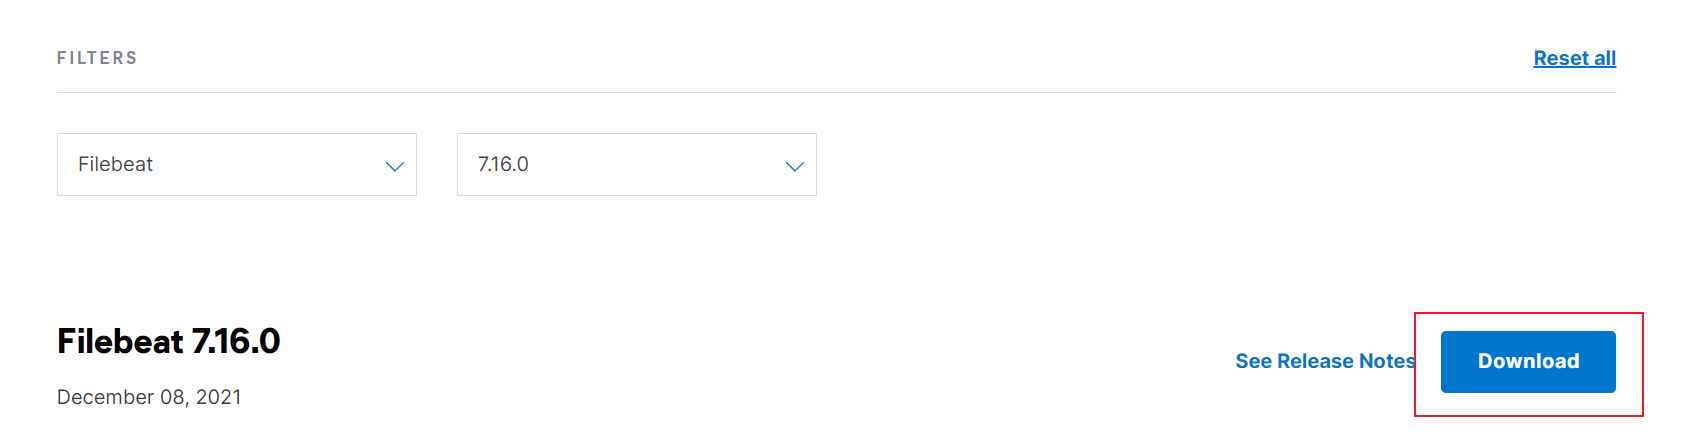
选择window版本
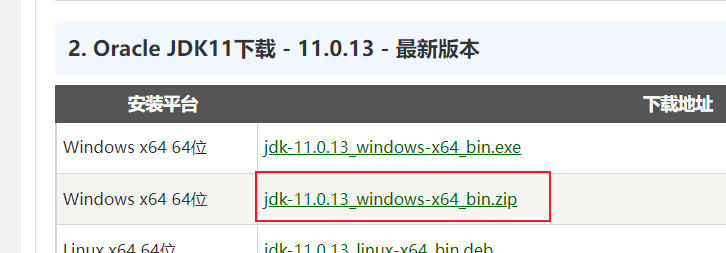
下载jdk11
由于7.16.0版本需要依赖java jdk11版本,需要将本地java环境切换到jdk11
访问网站: http://www.codebaoku.com/jdk/jdk-oracle-jdk11.html
点击下载
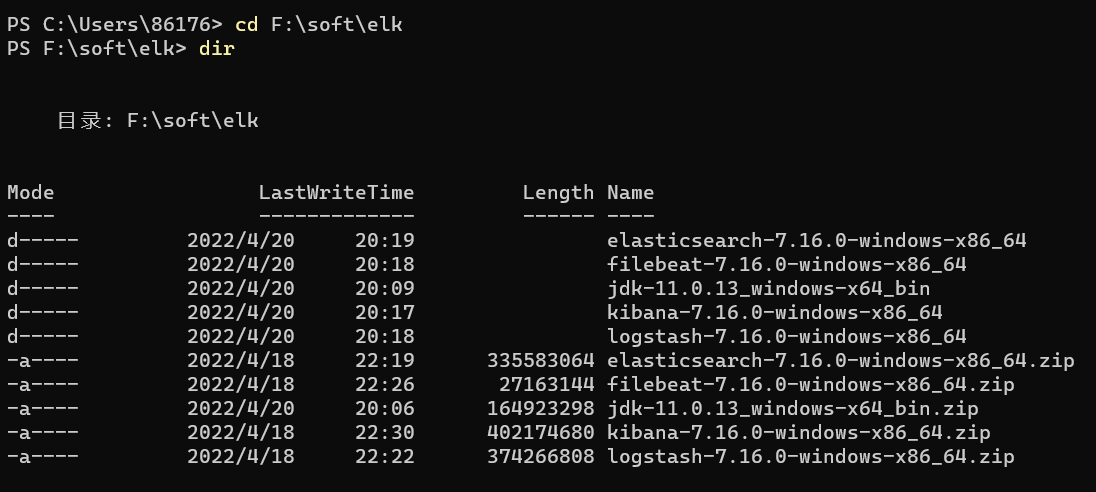
全部下载完解压
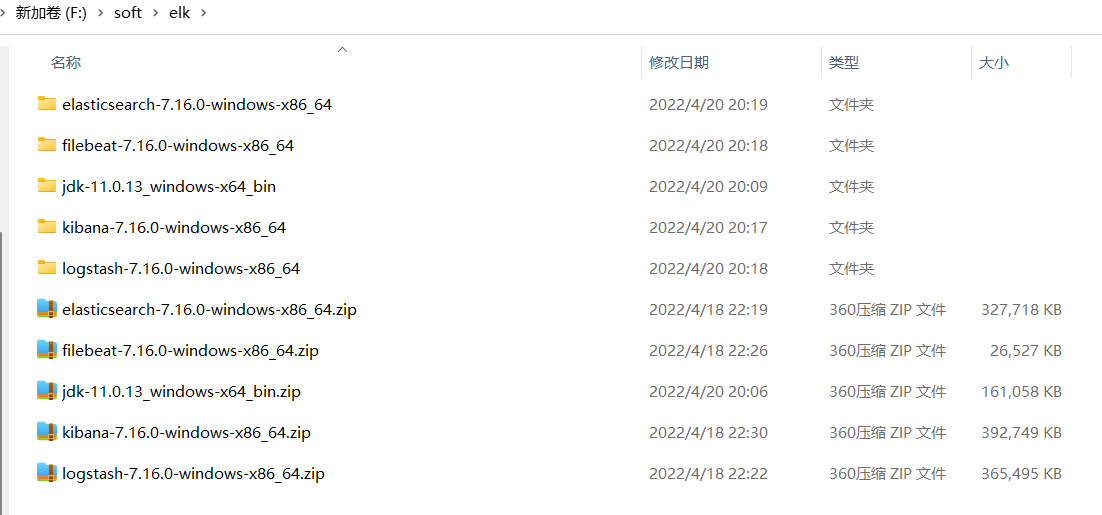
安装jdk11、elasticsearch、kibana、logstash、filebeat
安装jdk11
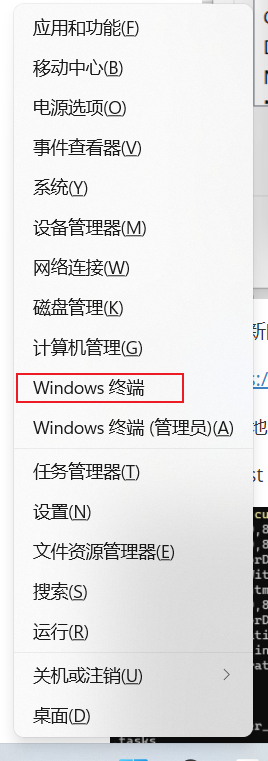
使用win+X键,并选择Windows终端
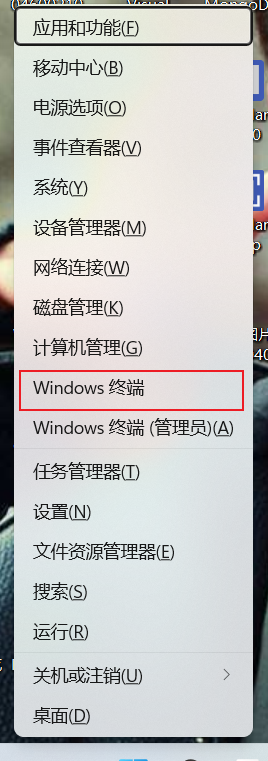
输入
1 | cd F:\soft\elk |
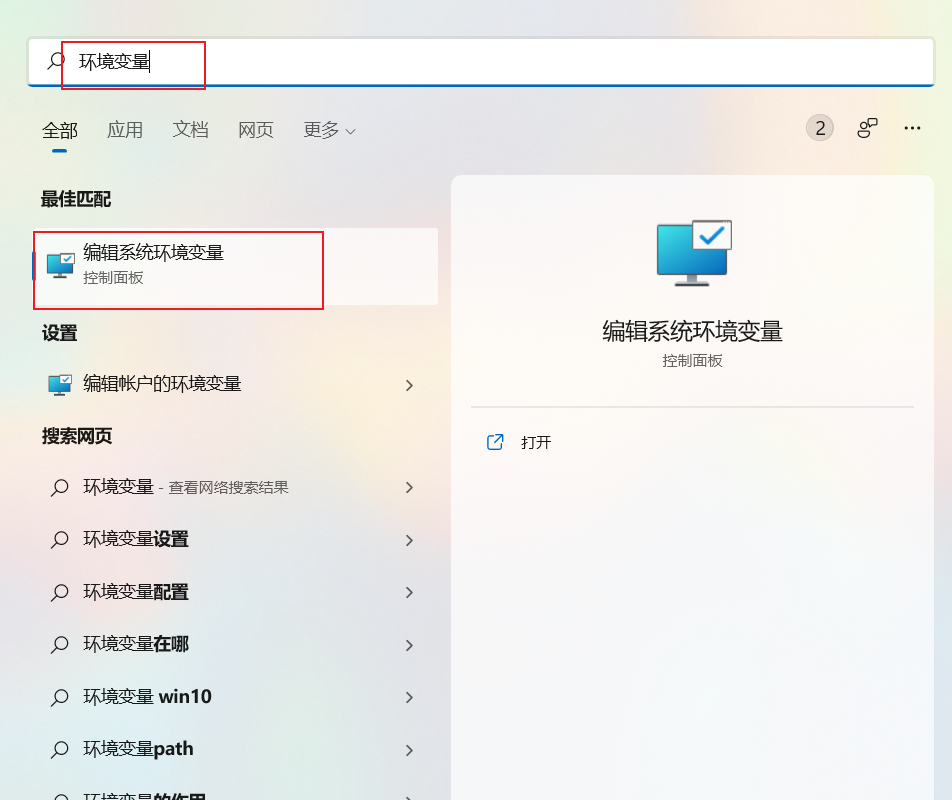
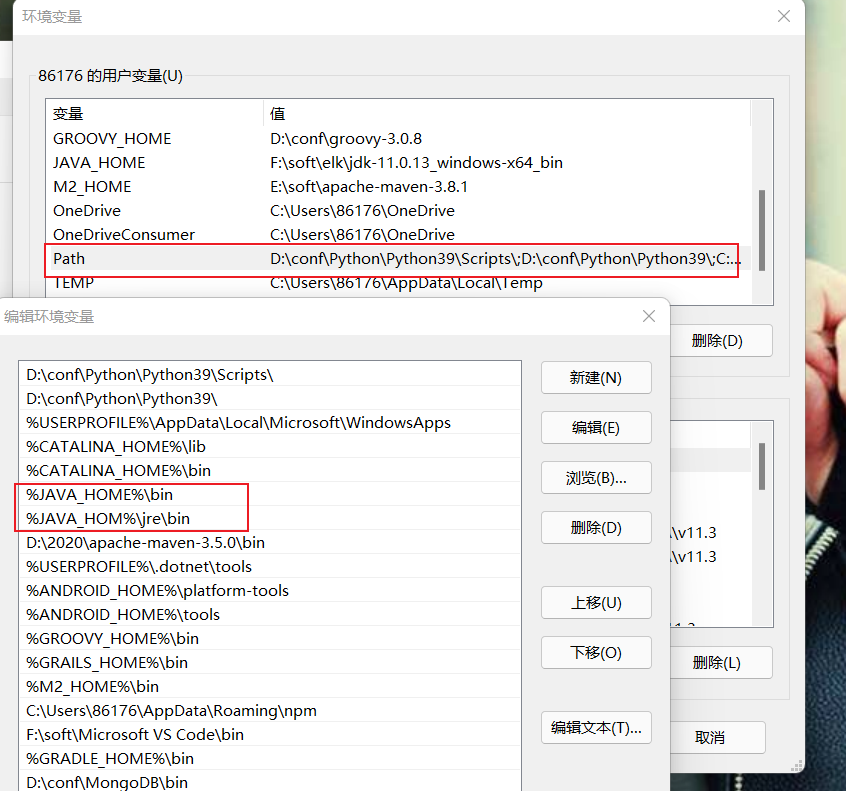
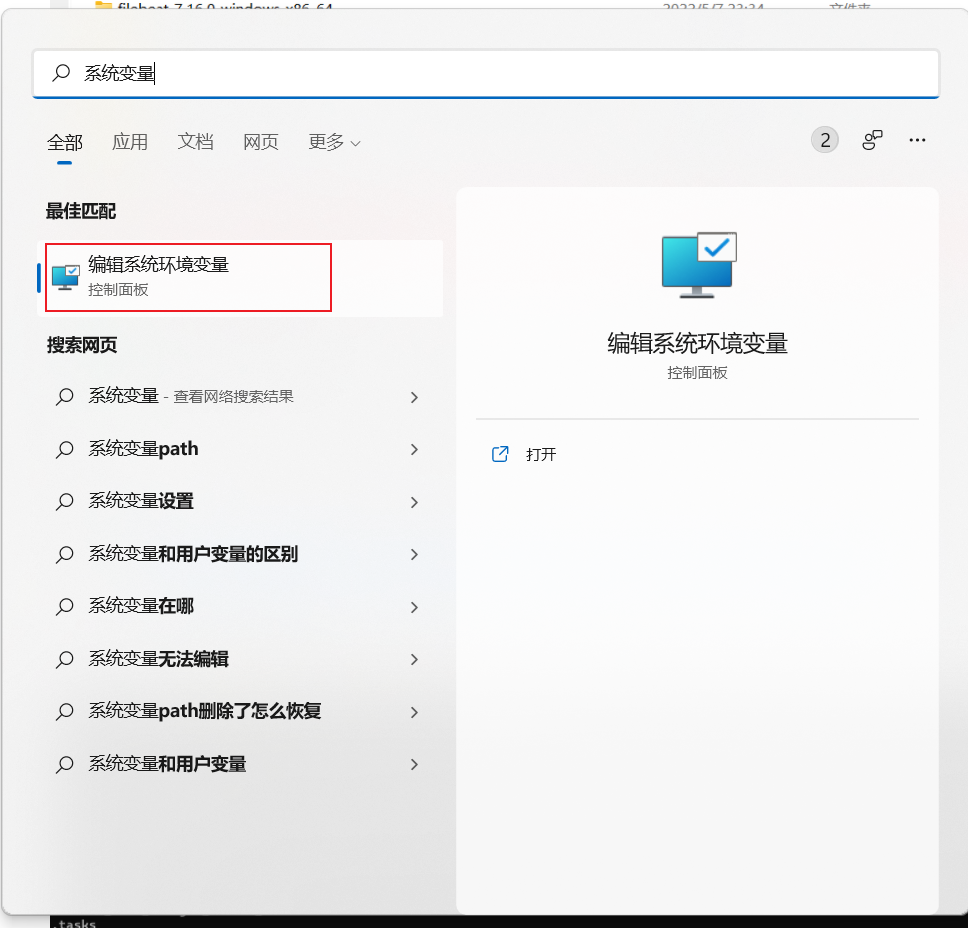
打开window搜索框搜索环境变量,打开编辑系统环境变量
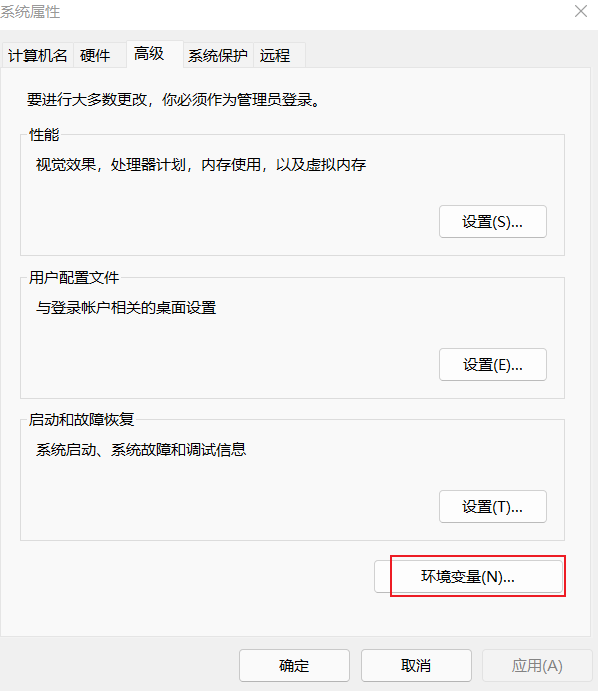
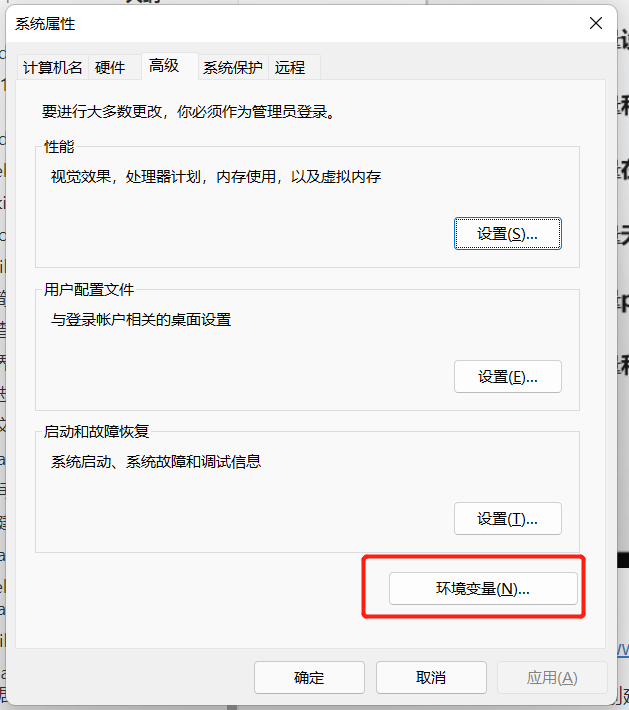
点击环境变量
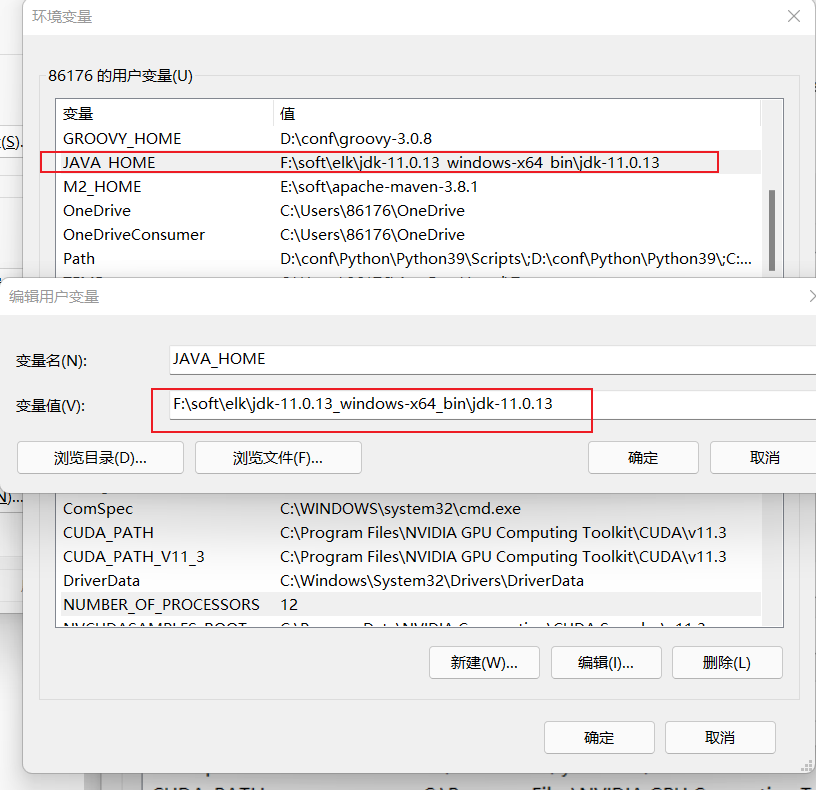
添加JAVA_HOME路径
1 | F:\soft\elk\jdk-11.0.13_windows-x64_bin\jdk-11.0.13 |
将java执行路径添加到Path变量中,输入
1 | JAVA_HOME%\bin |
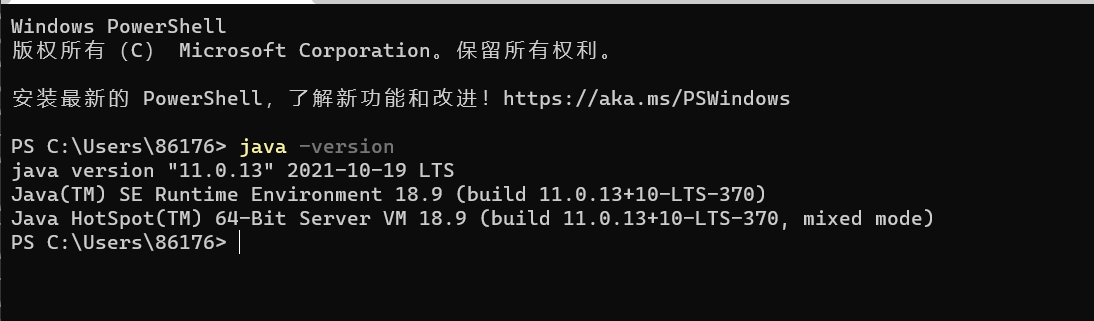
新打开一个shell(一定要重新打开一个新的shell才会加载刚配置过的jdk11环境变量)
并执行命令,可以看到jdk11提示输出,表示jdk11安装成功
1 | java -version |
启动elasticsearch
启动新的shell,并执行命令
1 | cd F:\soft\elk |
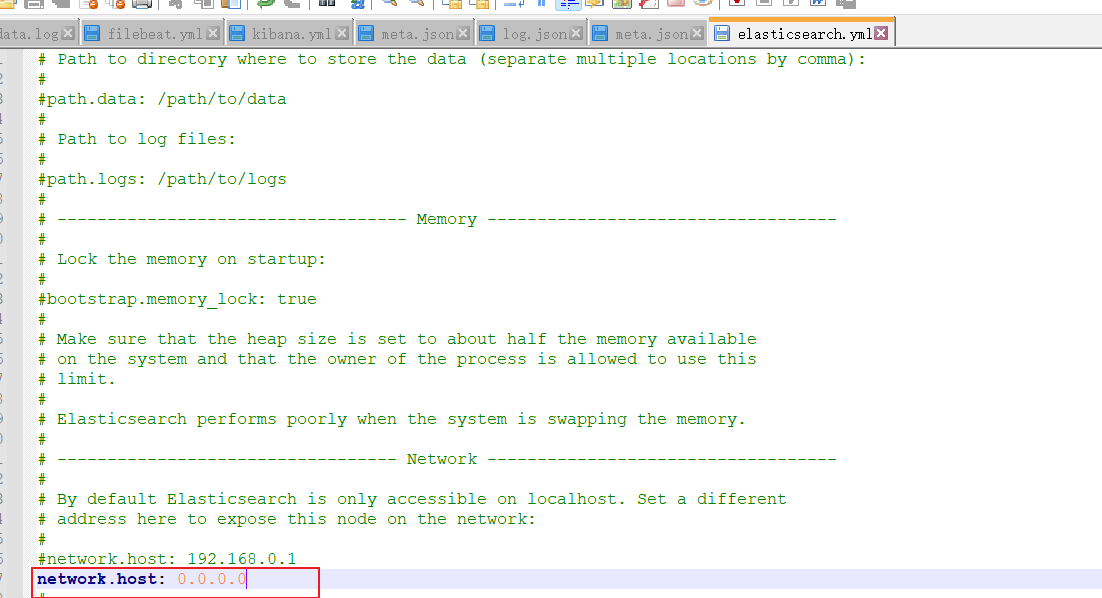
如果本地使用localhost访问,不需要修改配置文件,否则需要修改如下
1 | network.host: 0.0.0.0 |
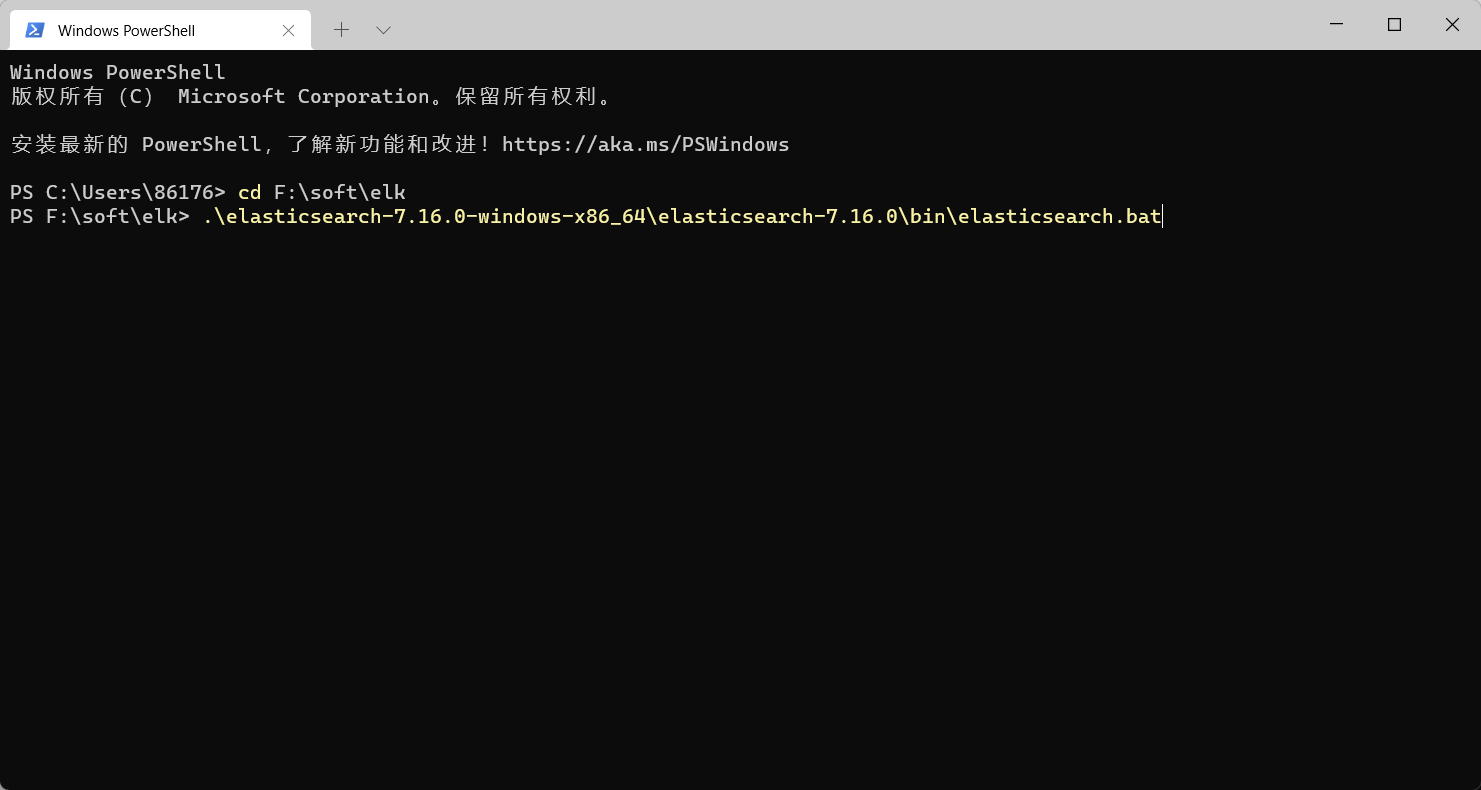
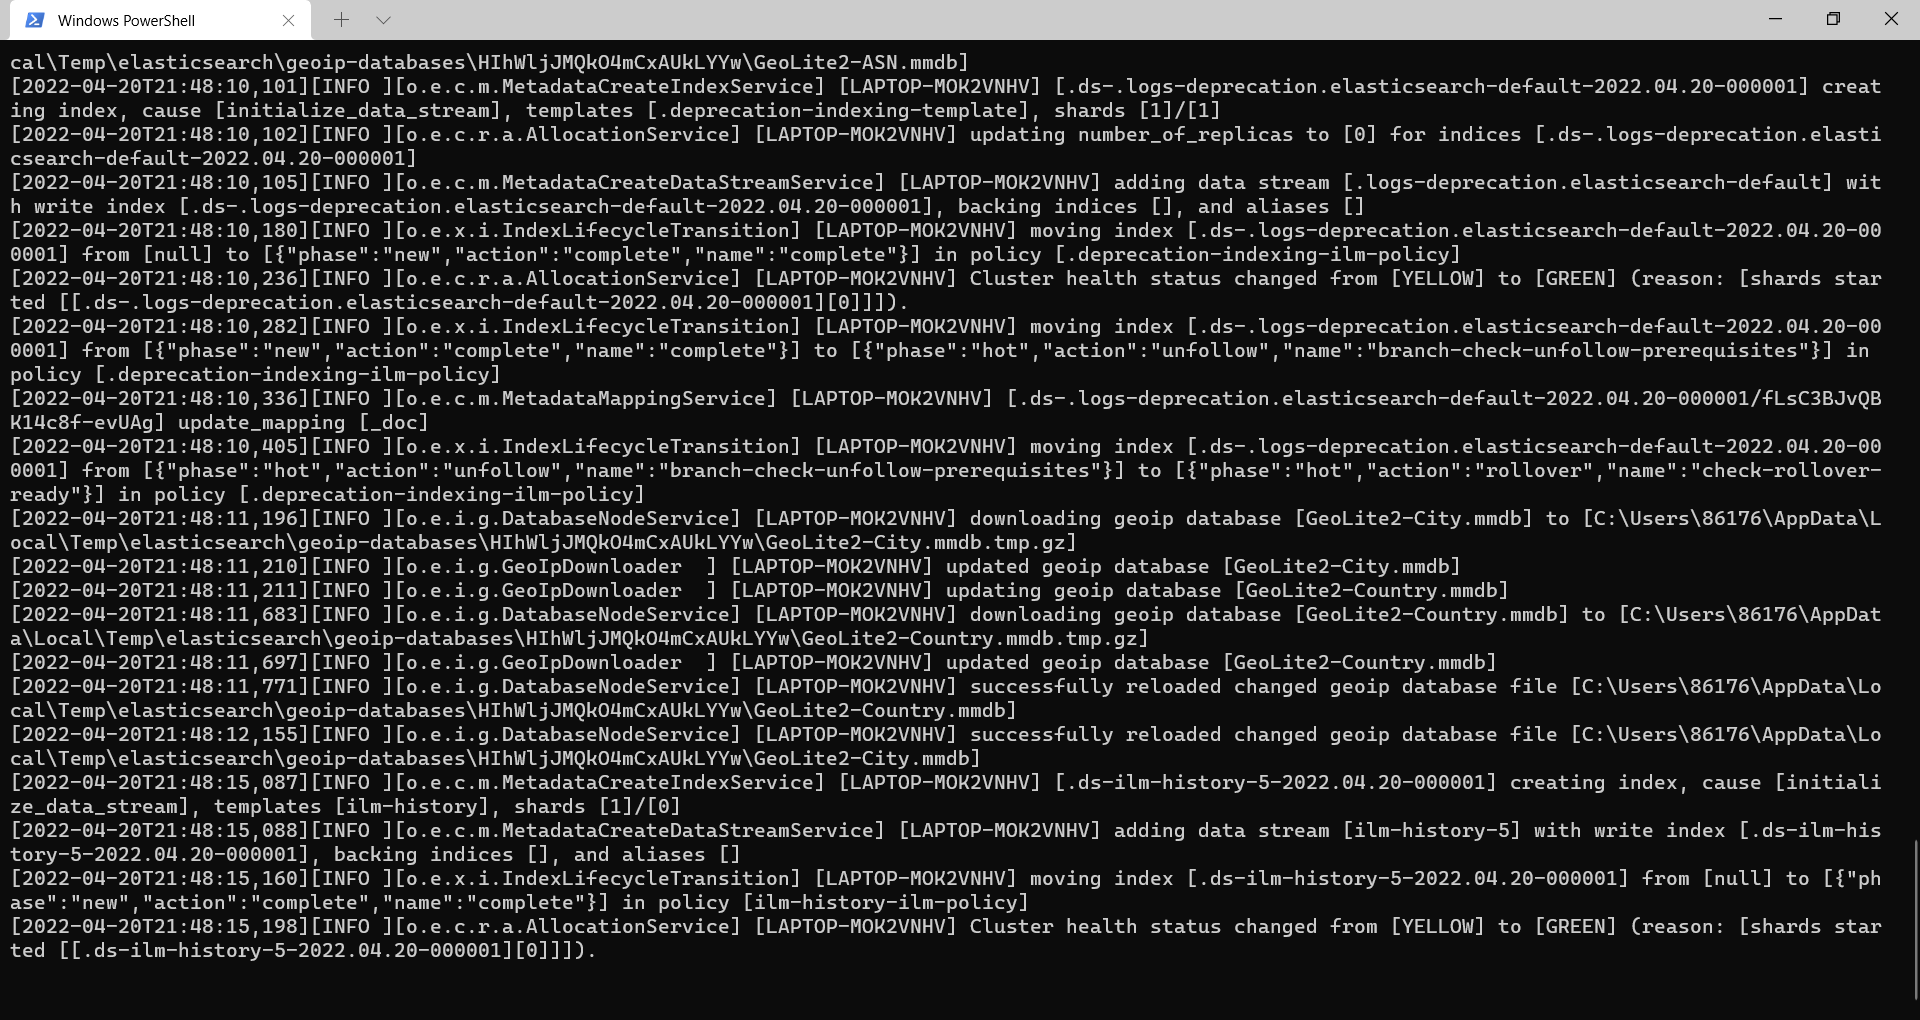
可以看到elasticsearch执行成功
启动kibana
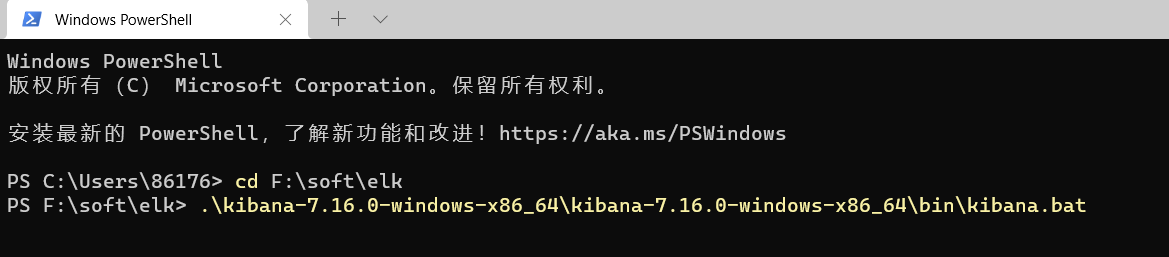
启动新的shell,并执行命令
1 | cd F:\soft\elk |
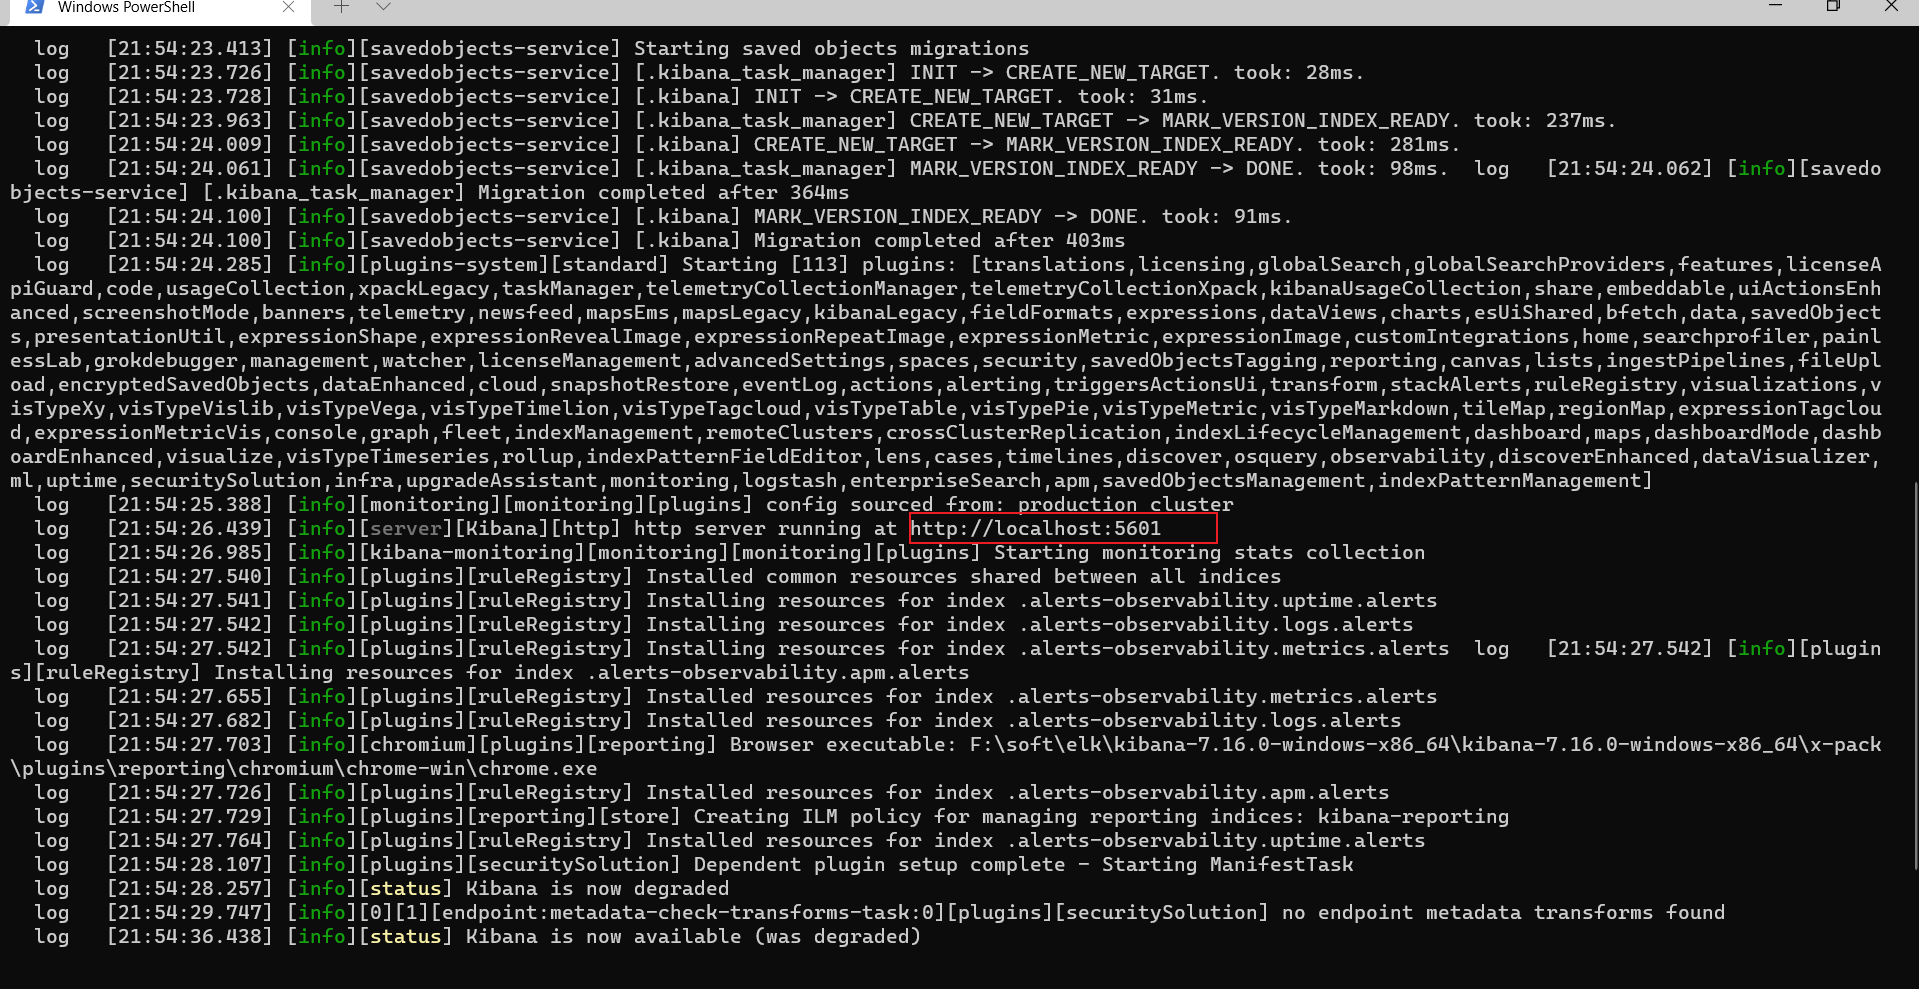
可以看到执行成功
访问网站,可以看到启动成功
http://localhost:5601/app/home#/
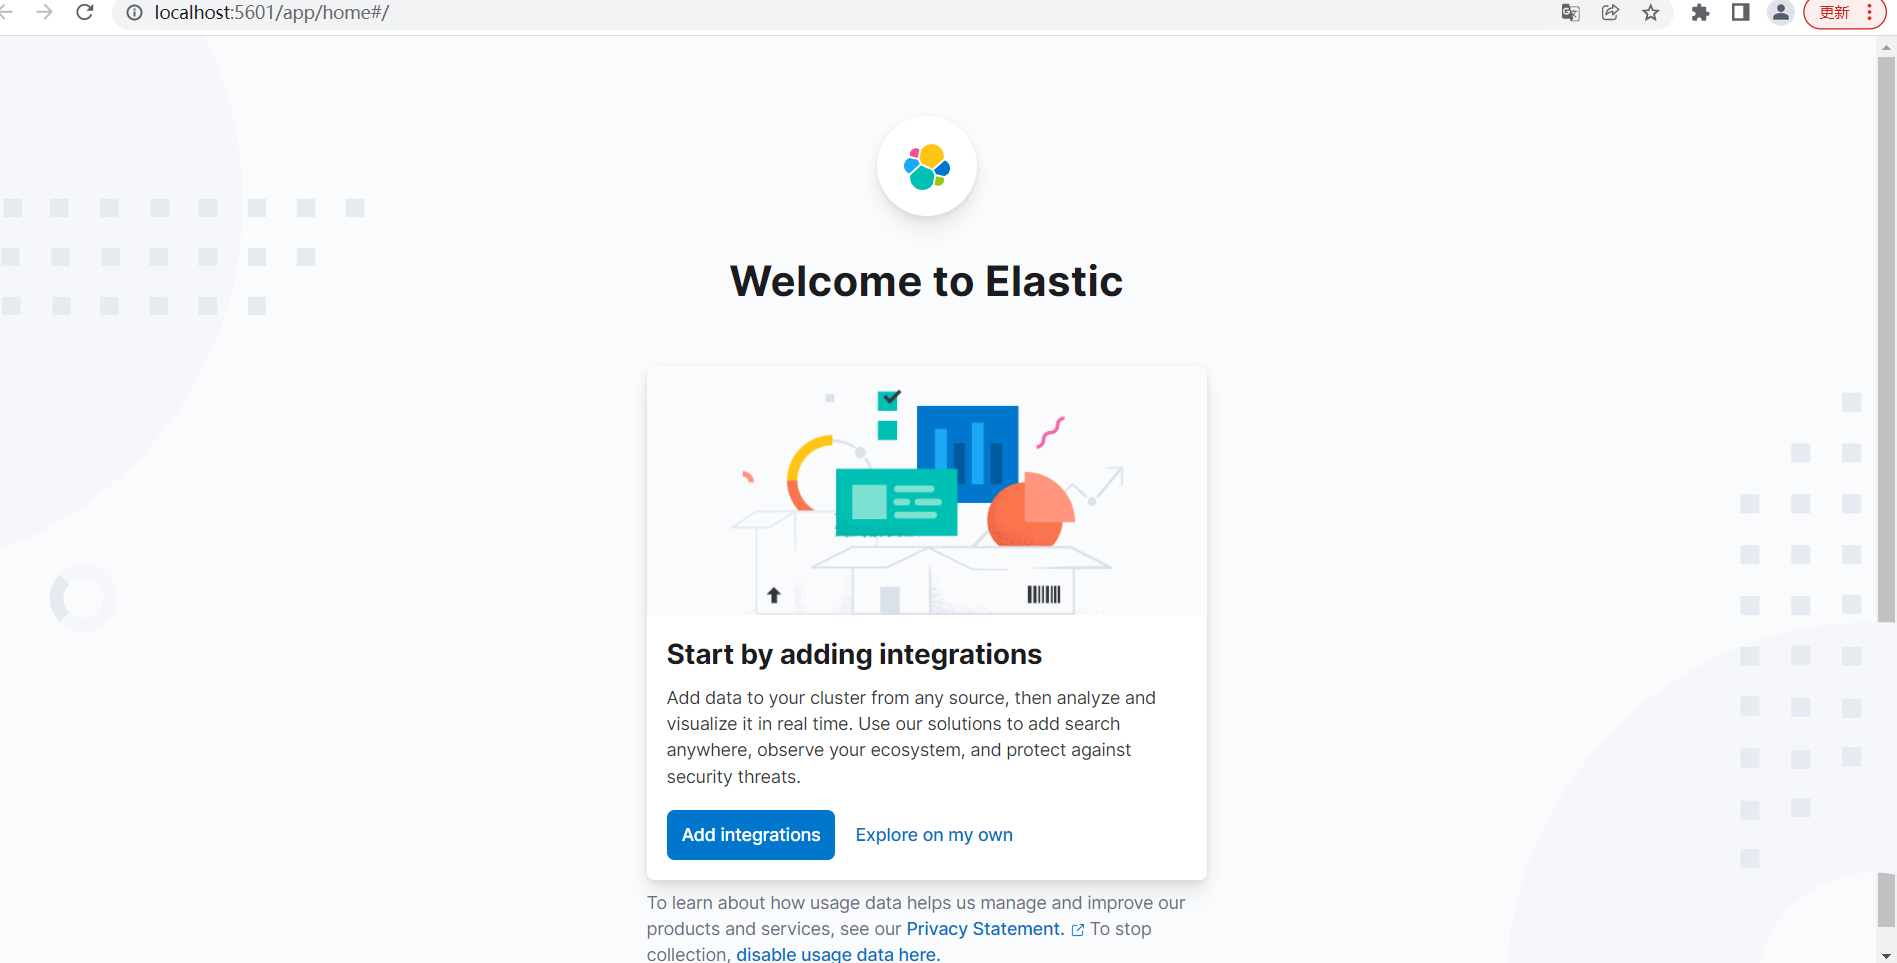
点击Explore on my own

启动logstash
进入
1 | F:\soft\elk\logstash-7.16.0-windows-x86_64\logstash-7.16.0\config |
在logstash配置文件中,新增文件名log.conf
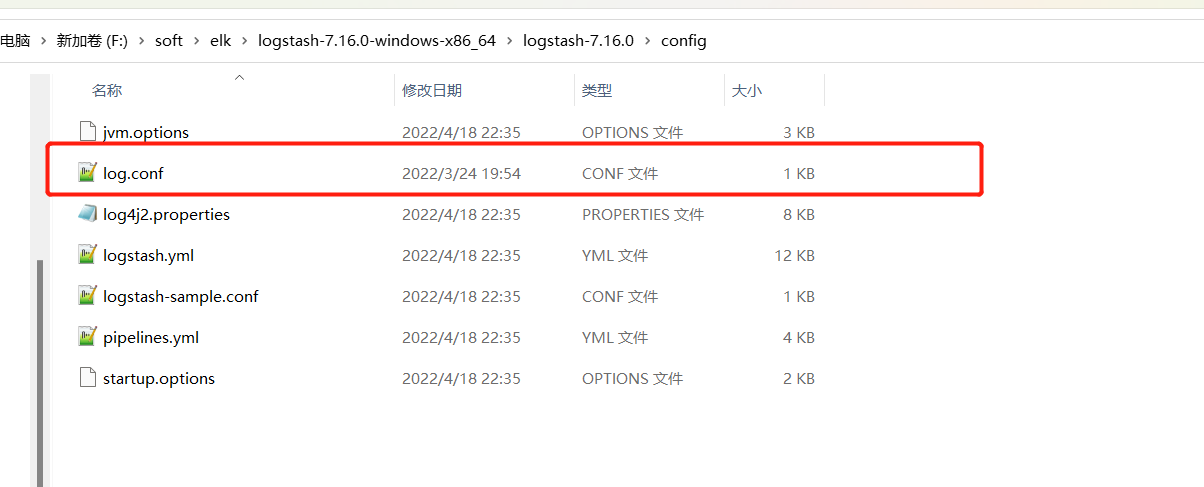
内容如下:
输入指定通过5044端口使用Filebeat接收数据。
指定在elasticsearch中创建test的索引,将数据输出到test索引中。
1 | Sample Logstash configuration for creating a simple |
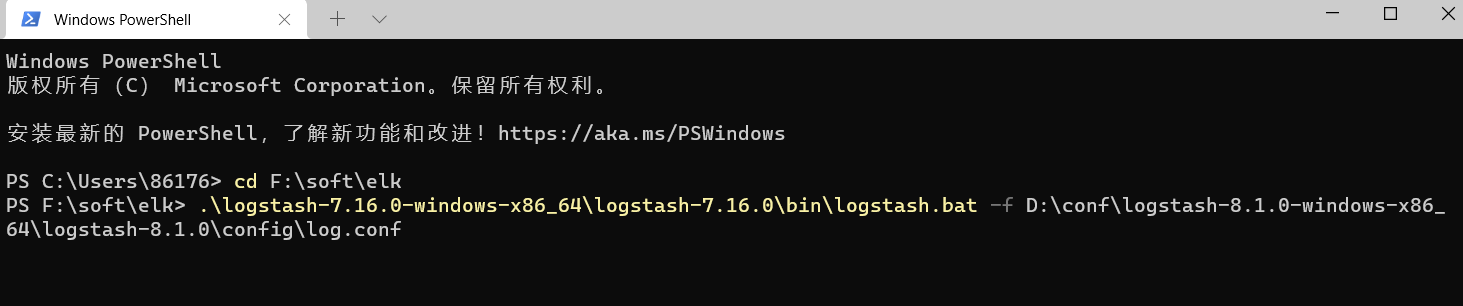
启动新的shell,并执行命令
1 | cd F:\soft\elk |
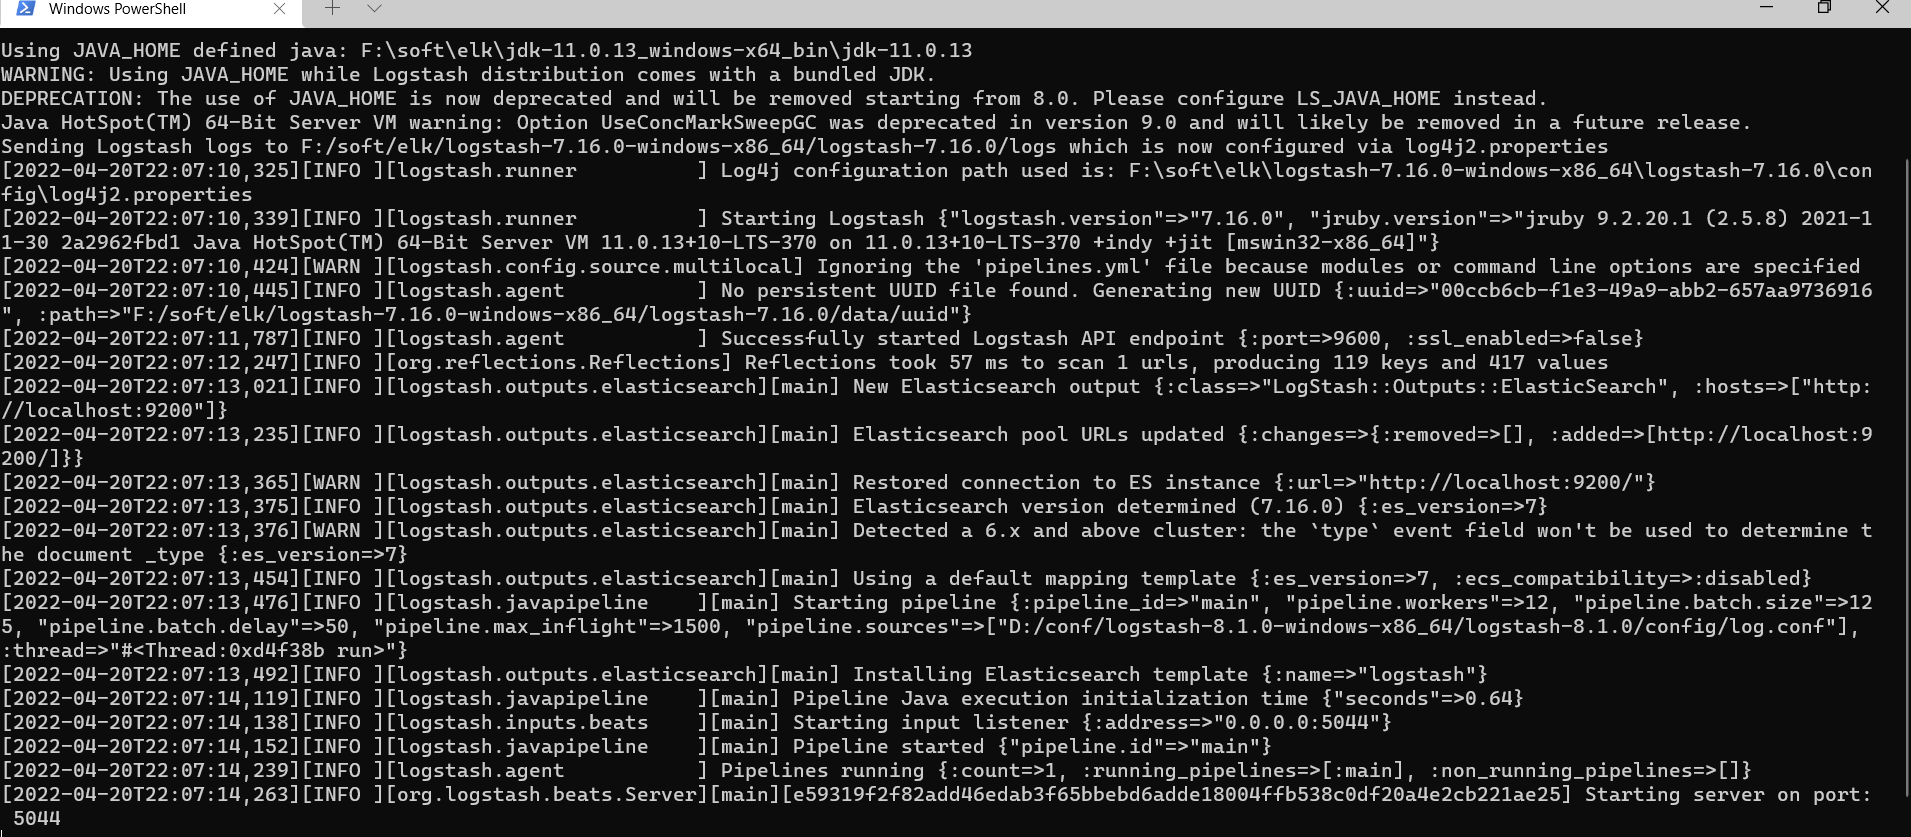
可以看到启动成功
启动filebeat
进入
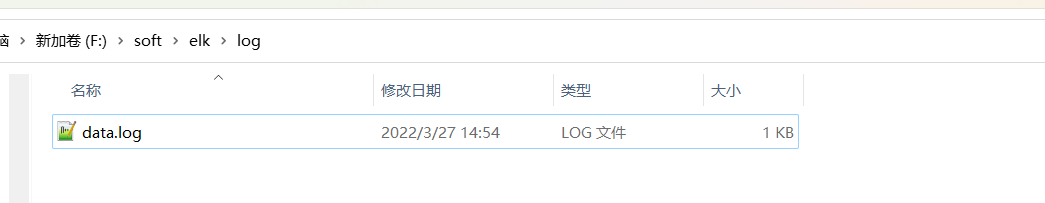
1 | F:\soft\elk\log |
新建日志log测试日志文件夹
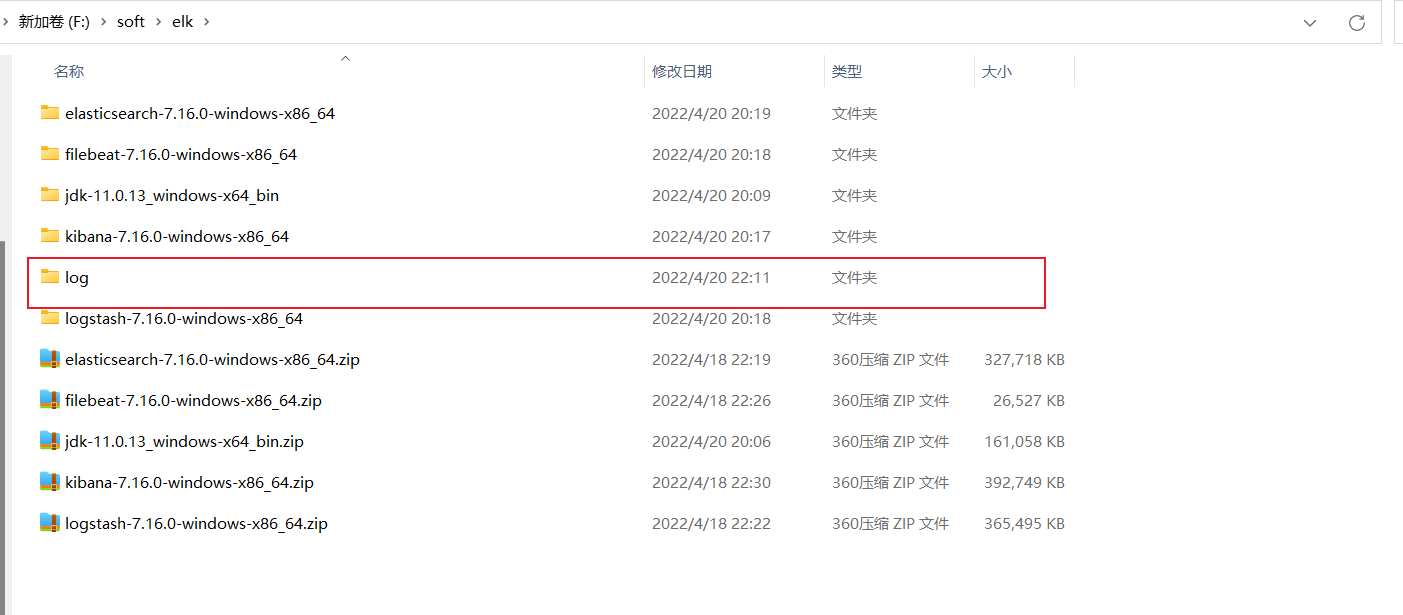
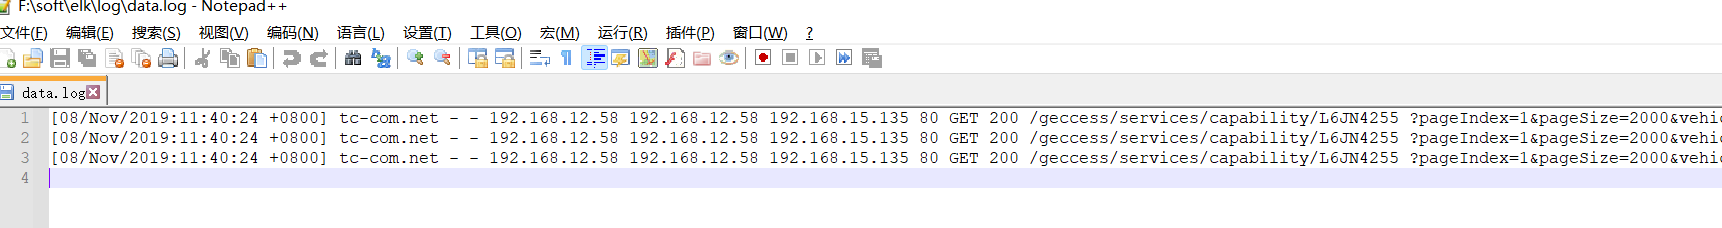
进入log文件夹,创建data.log文件
内容为
1 | [08/Nov/2019:11:40:24 +0800] tc-com.net - - 192.168.12.58 192.168.12.58 192.168.15.135 80 GET 200 /geccess/services/capability/L6JN4255 ?pageIndex=1&pageSize=2000&vehicleType=0 21067 17 totalTime:54ms |
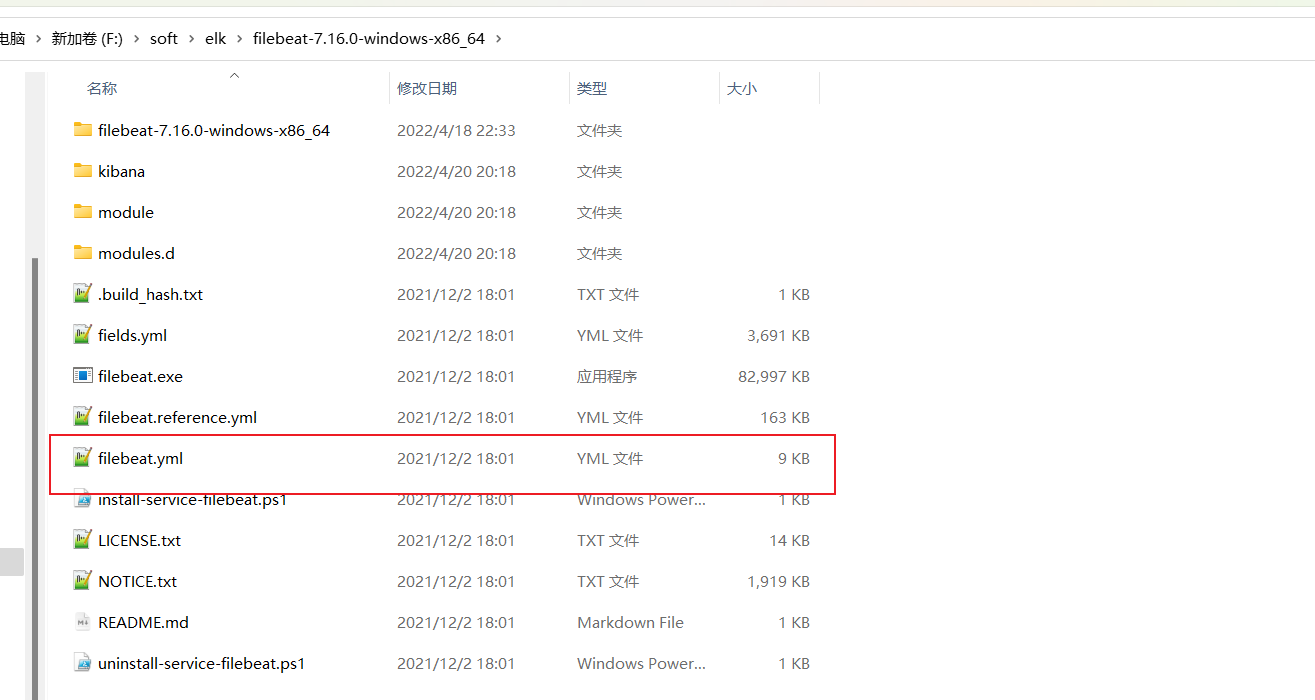
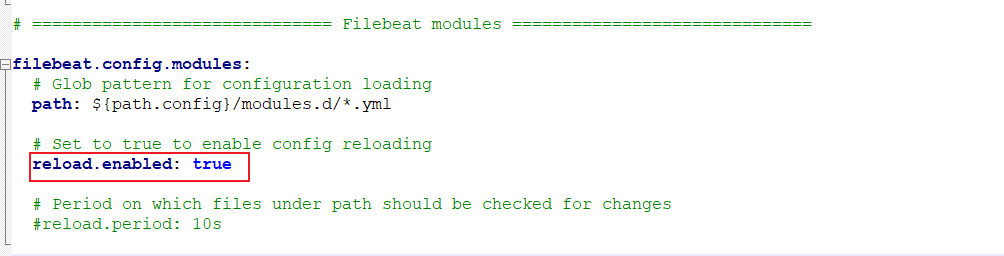
编辑filebeat文件
进入到
1 | F:\soft\elk\filebeat-7.16.0-windows-x86_64 |
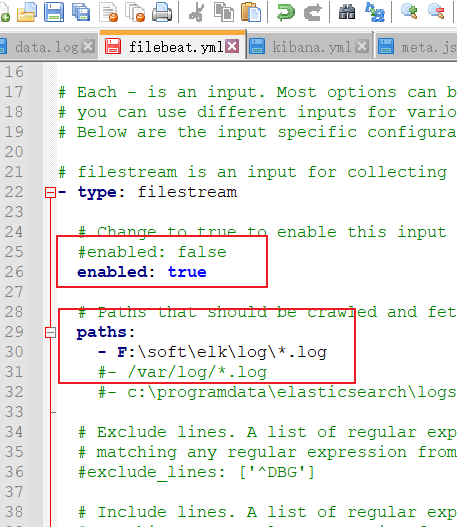
将enable改成true,同时设置日志路径为
1 | F:\soft\elk\log\*.log |
将filebeat.config.modules的enable改成true
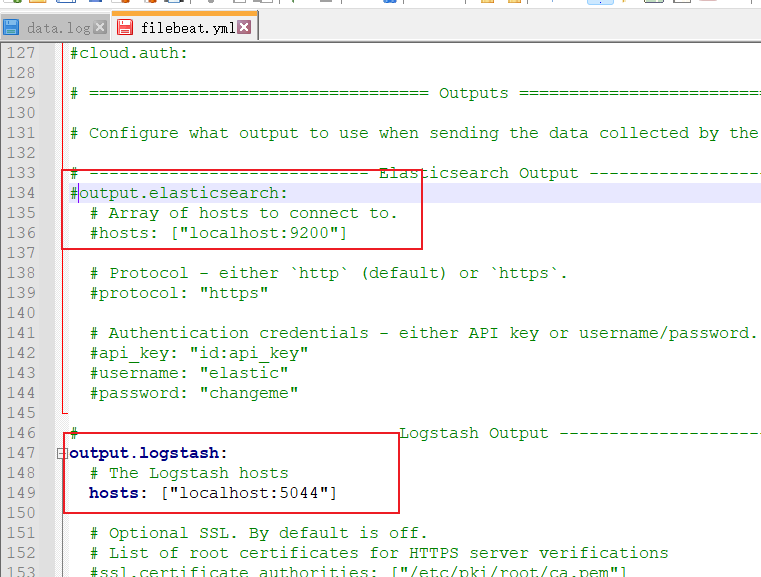
将输出到elasticsearch中使用#注释去掉,并将输出到logstash注释删除掉
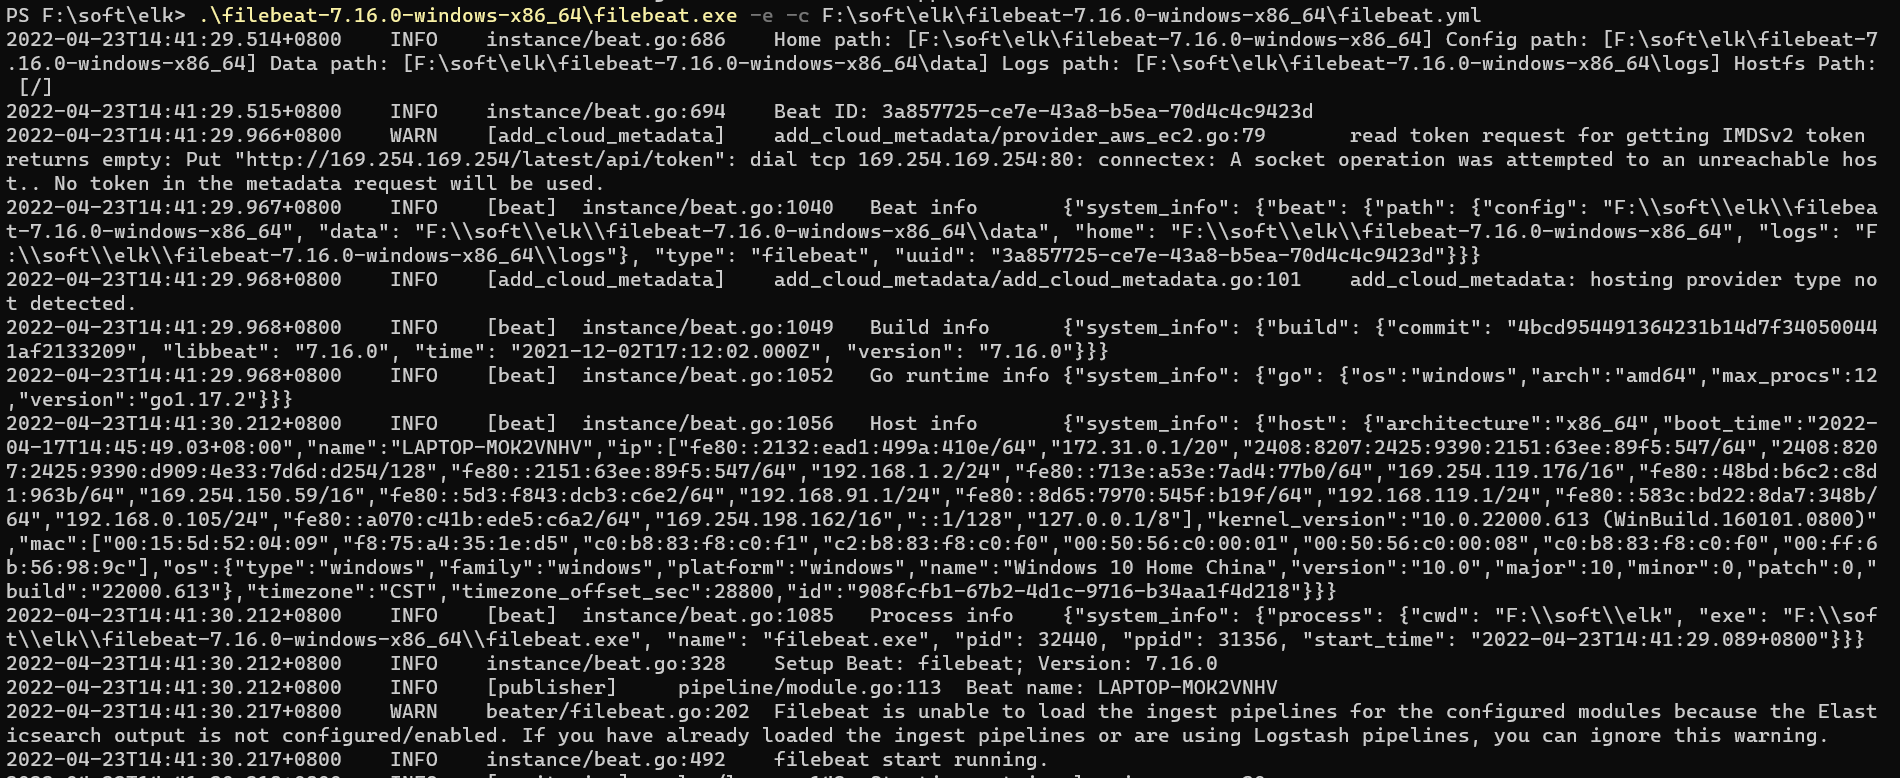
1 | cd F:\soft\elk |
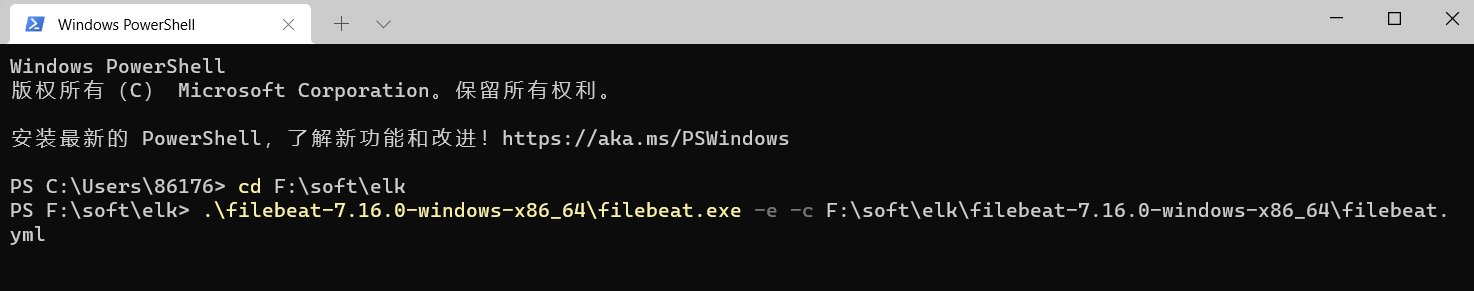
可以看到filebeat运行成功
kibana简单查询日志
命令查询创建的索引数据
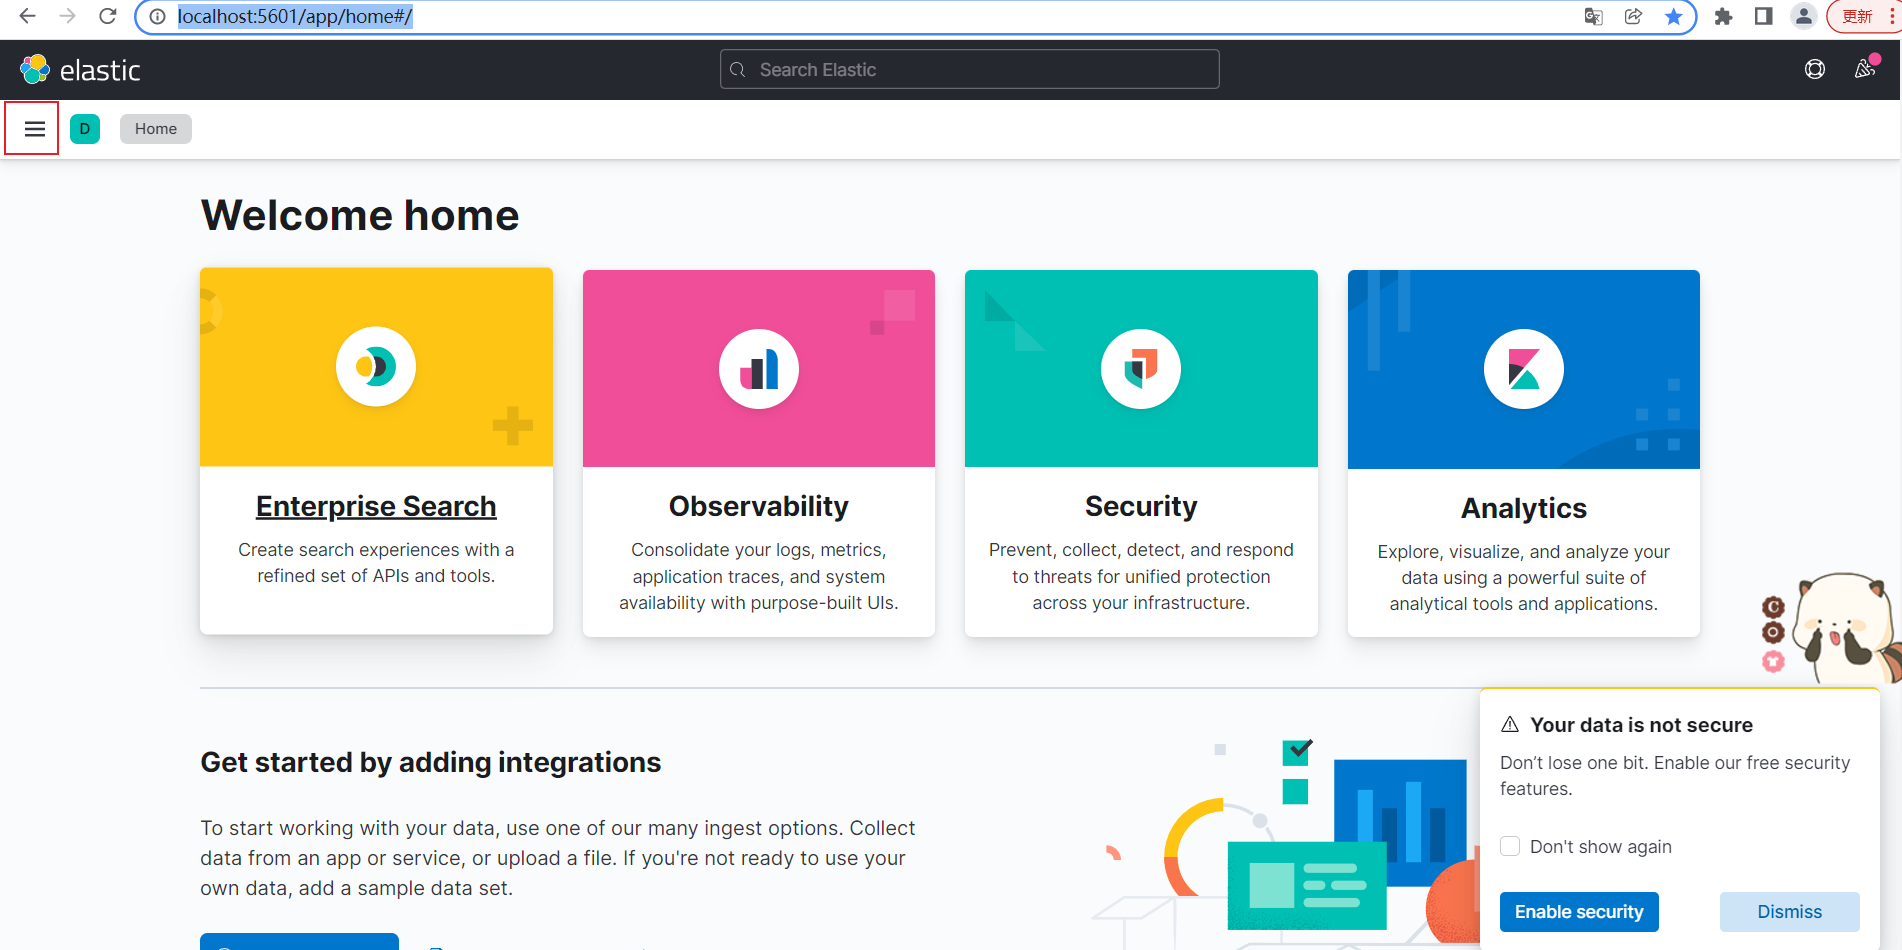
访问网站,并点击左上角
http://localhost:5601/app/home#/
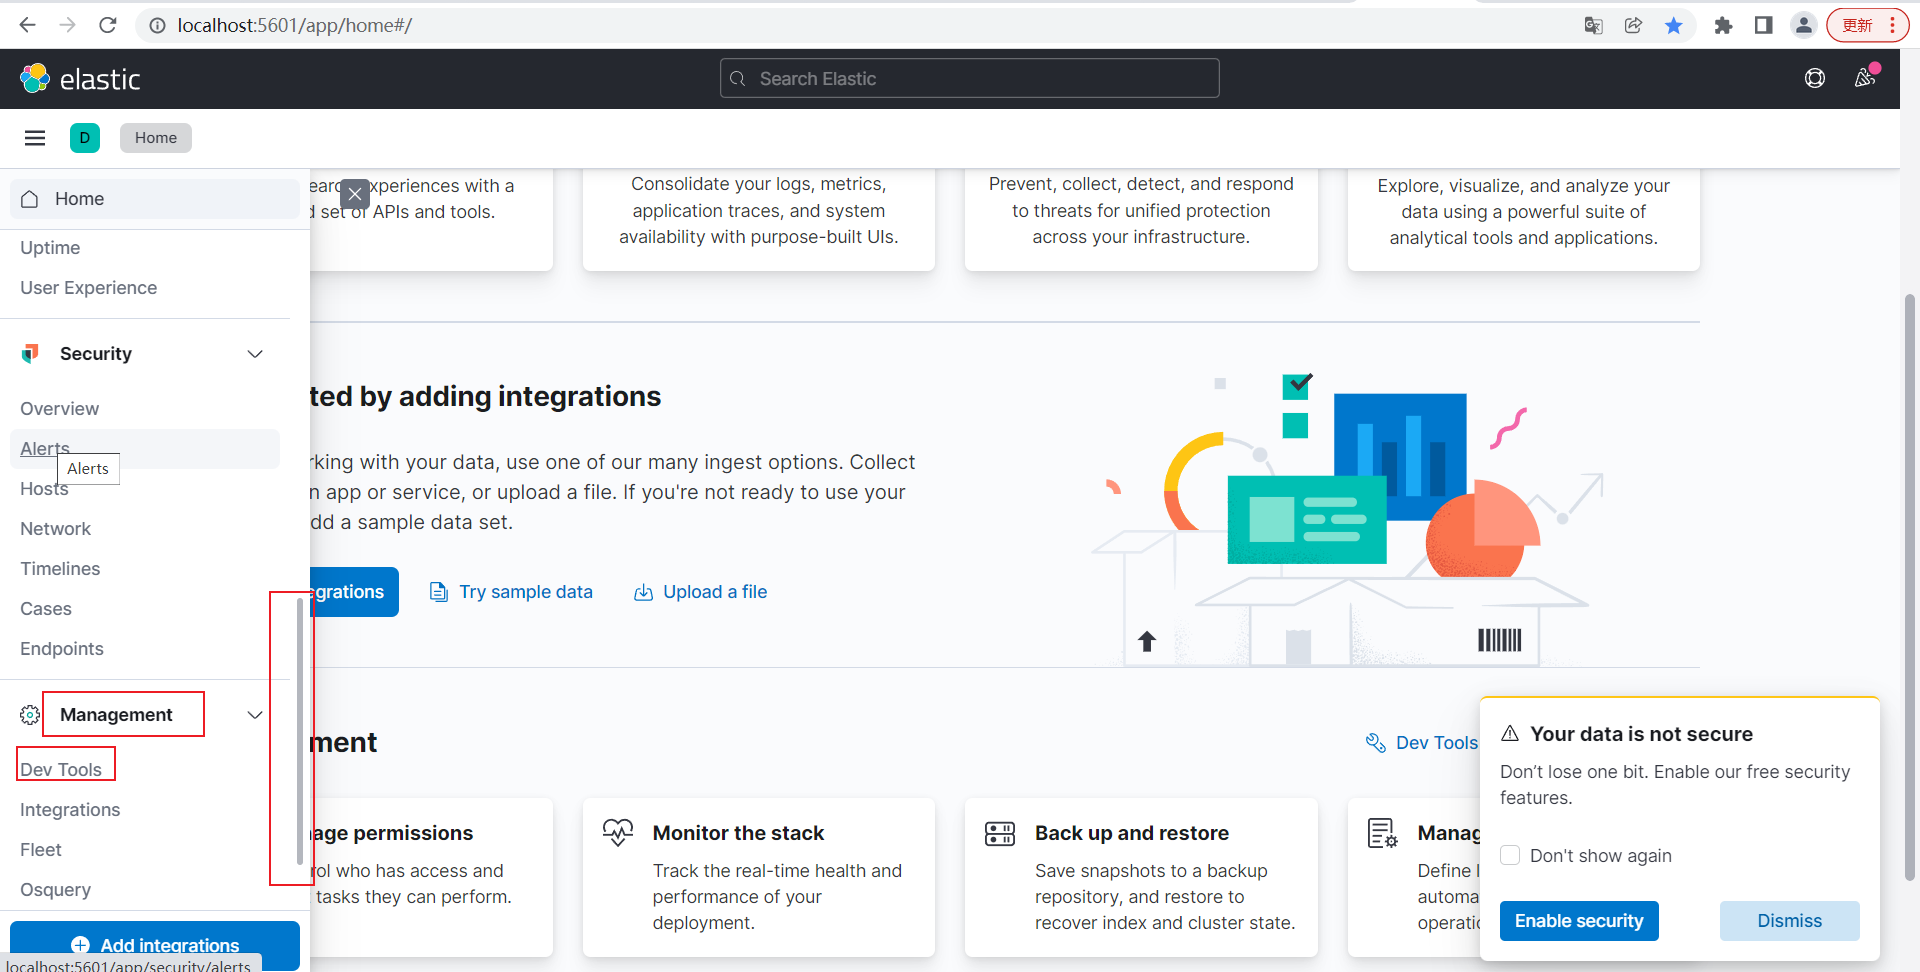
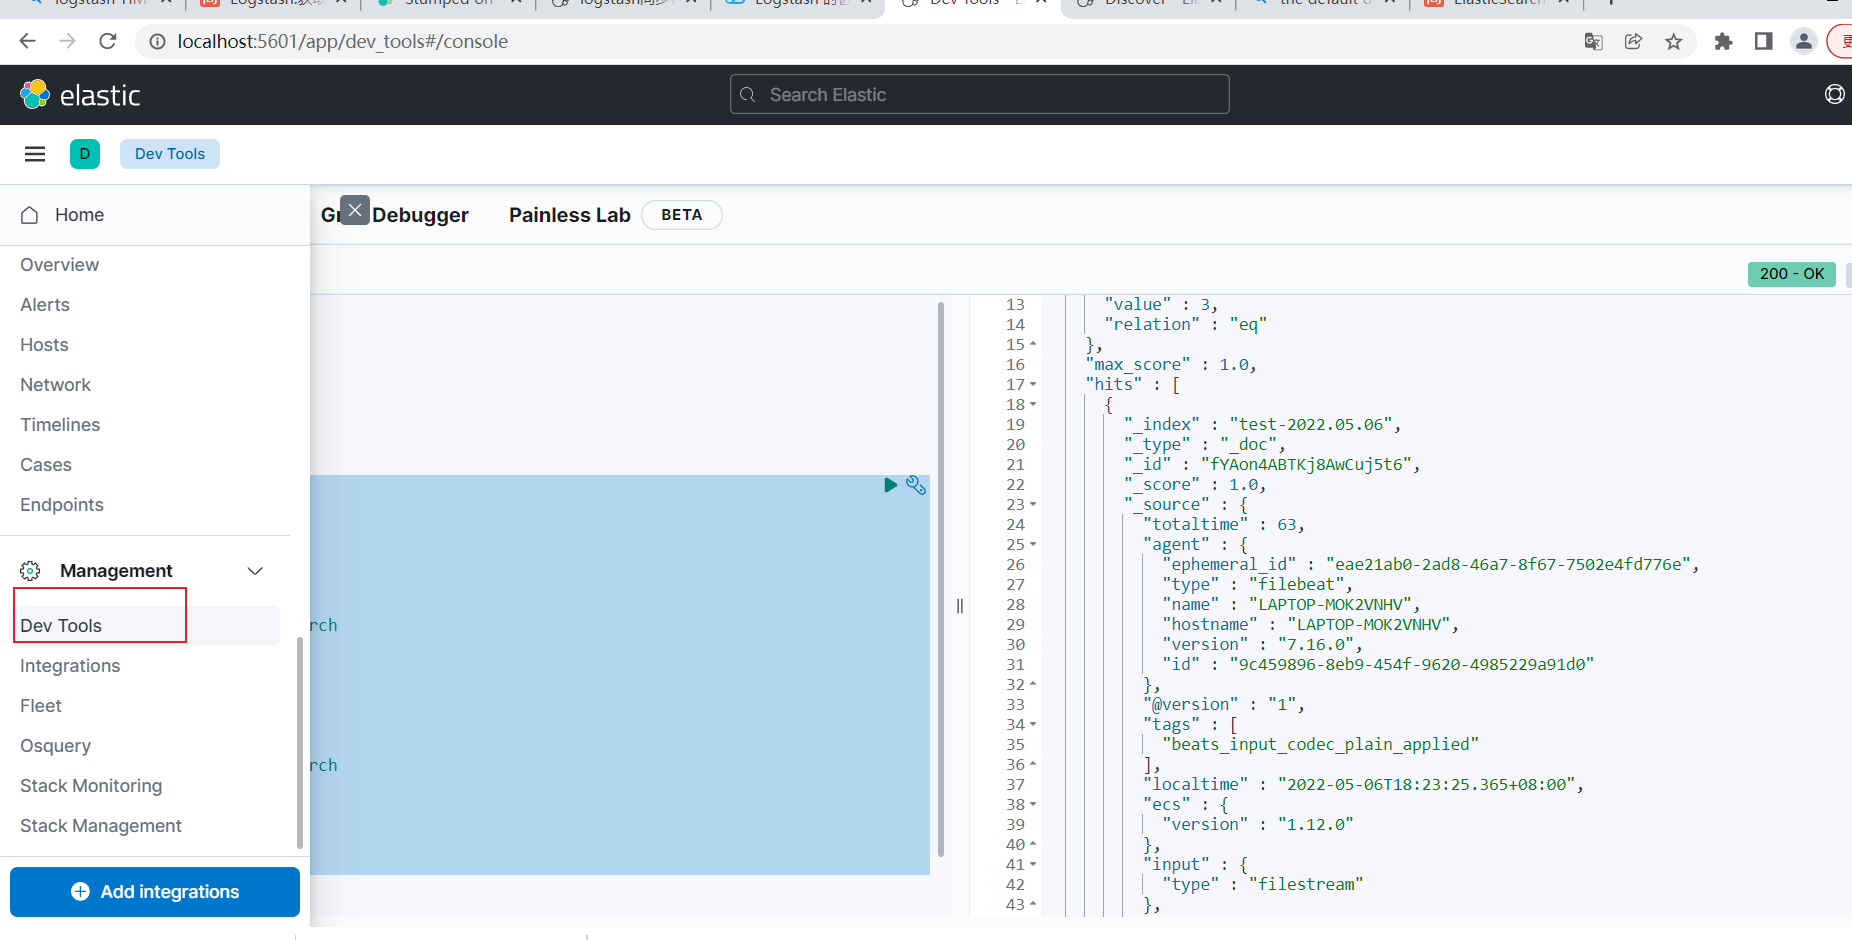
左侧向下滑动,选中management,并点击Dev Tools
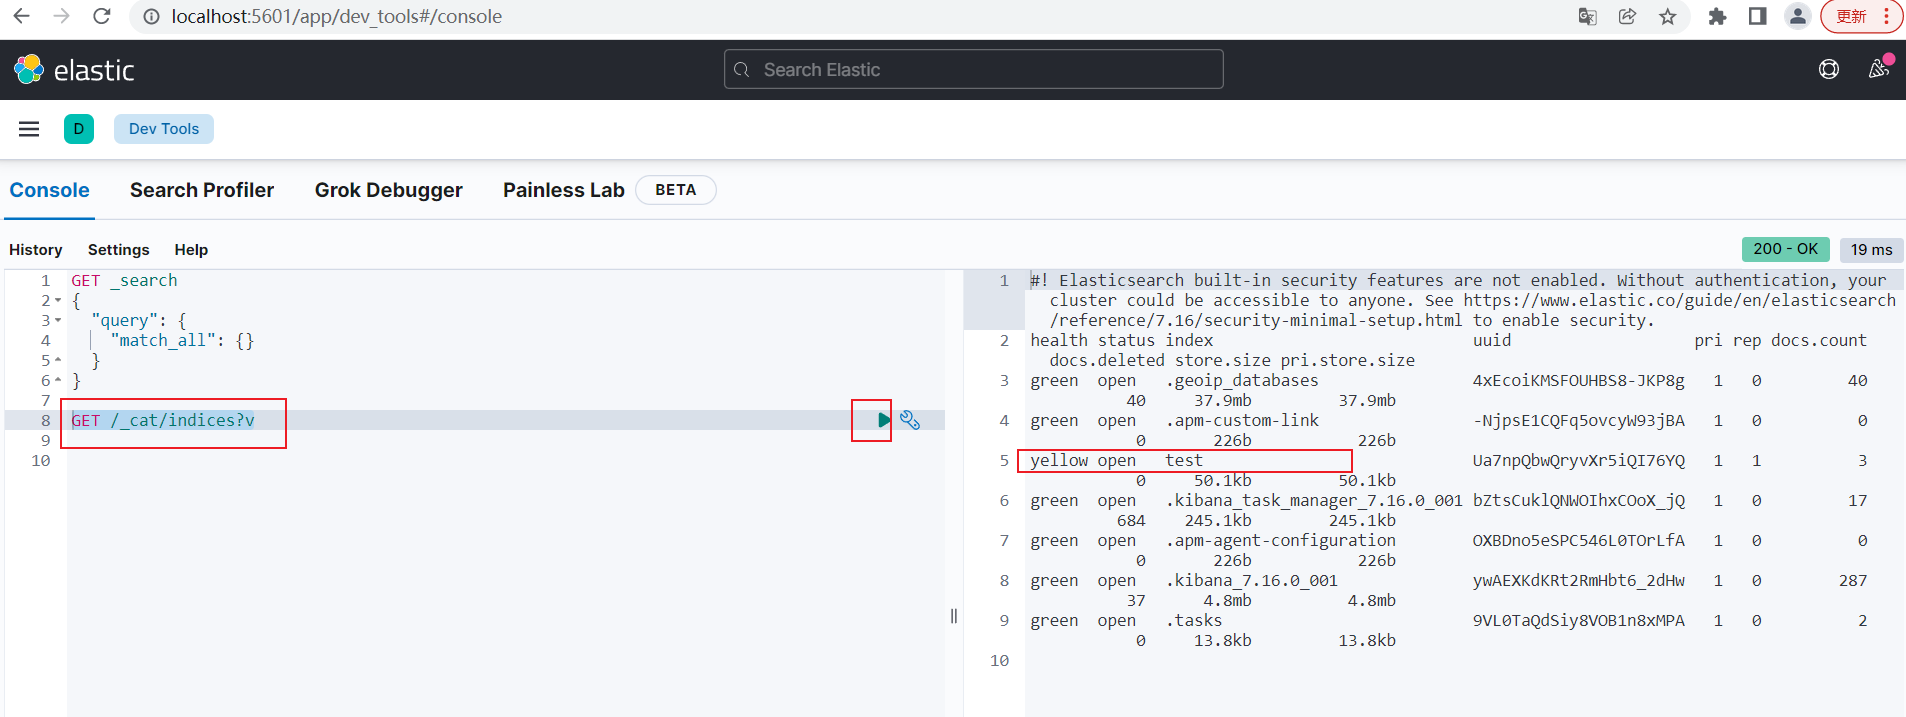
在Console输入下面命令
1 | GET /_cat/indices?v |
在点击绿色执行按钮,可以看到,索引test已经创建
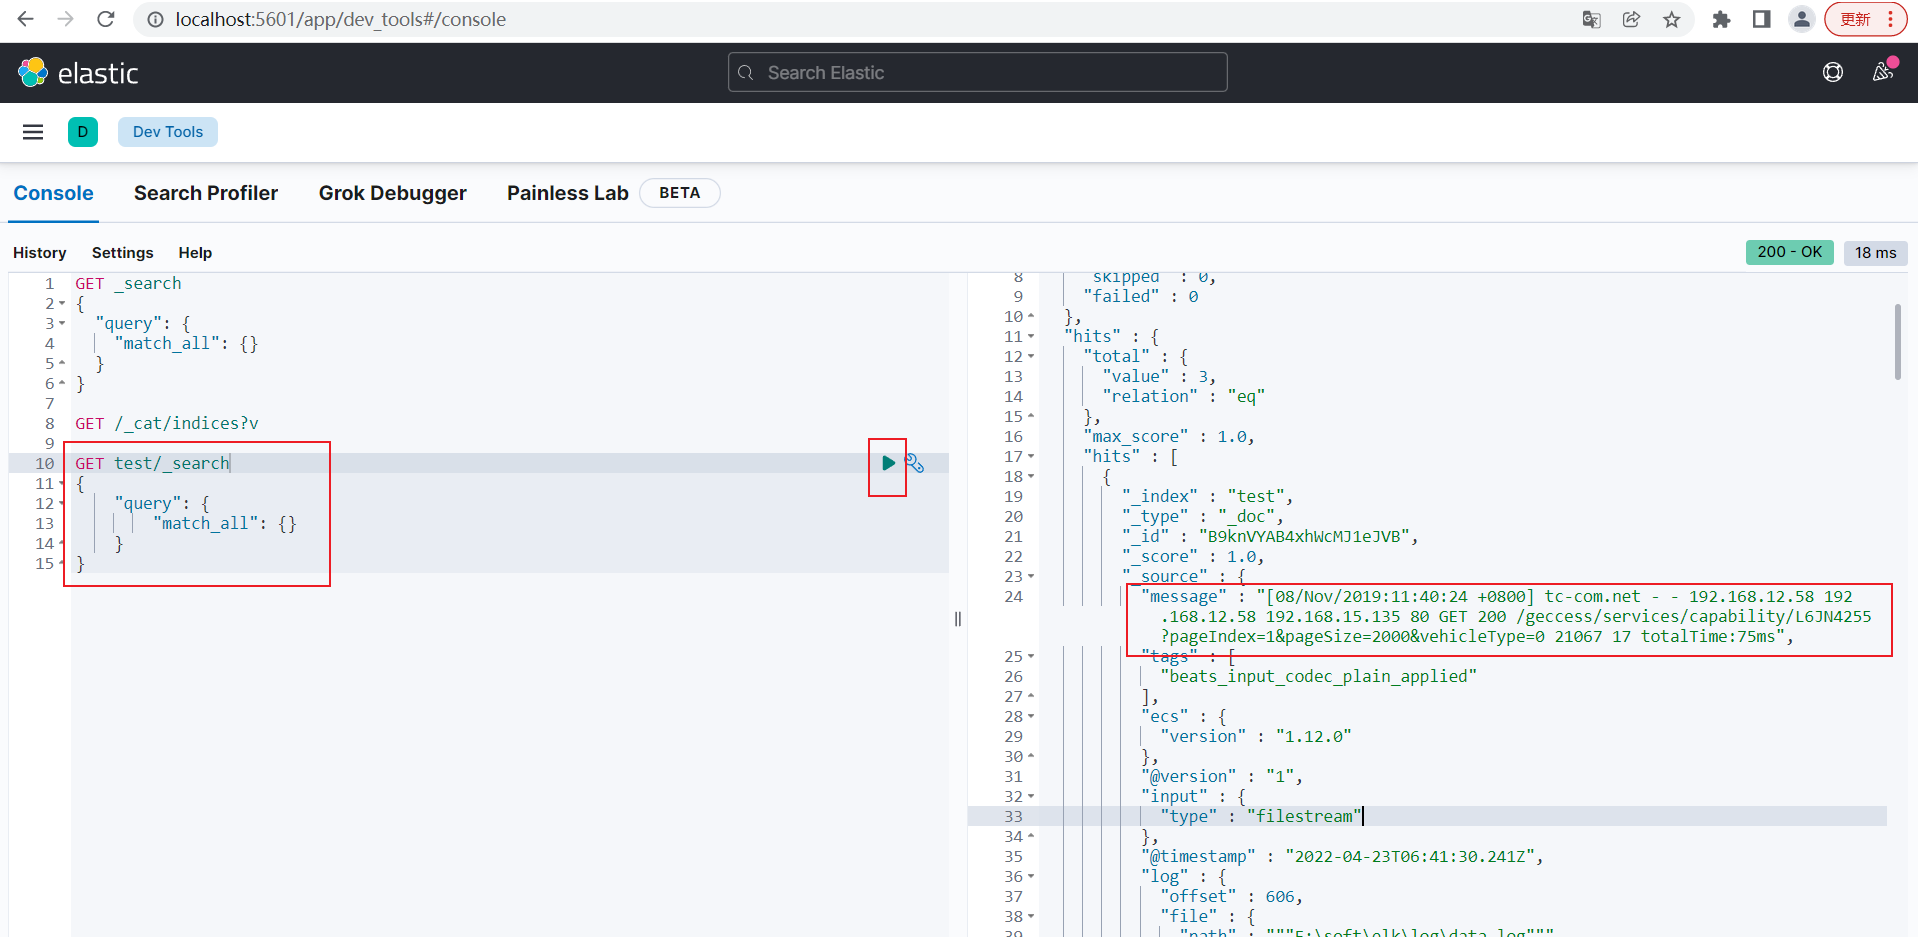
输入下面命令,查询索引test的数据,可以看到日志数据已经成功上传
1 | GET test/_search |
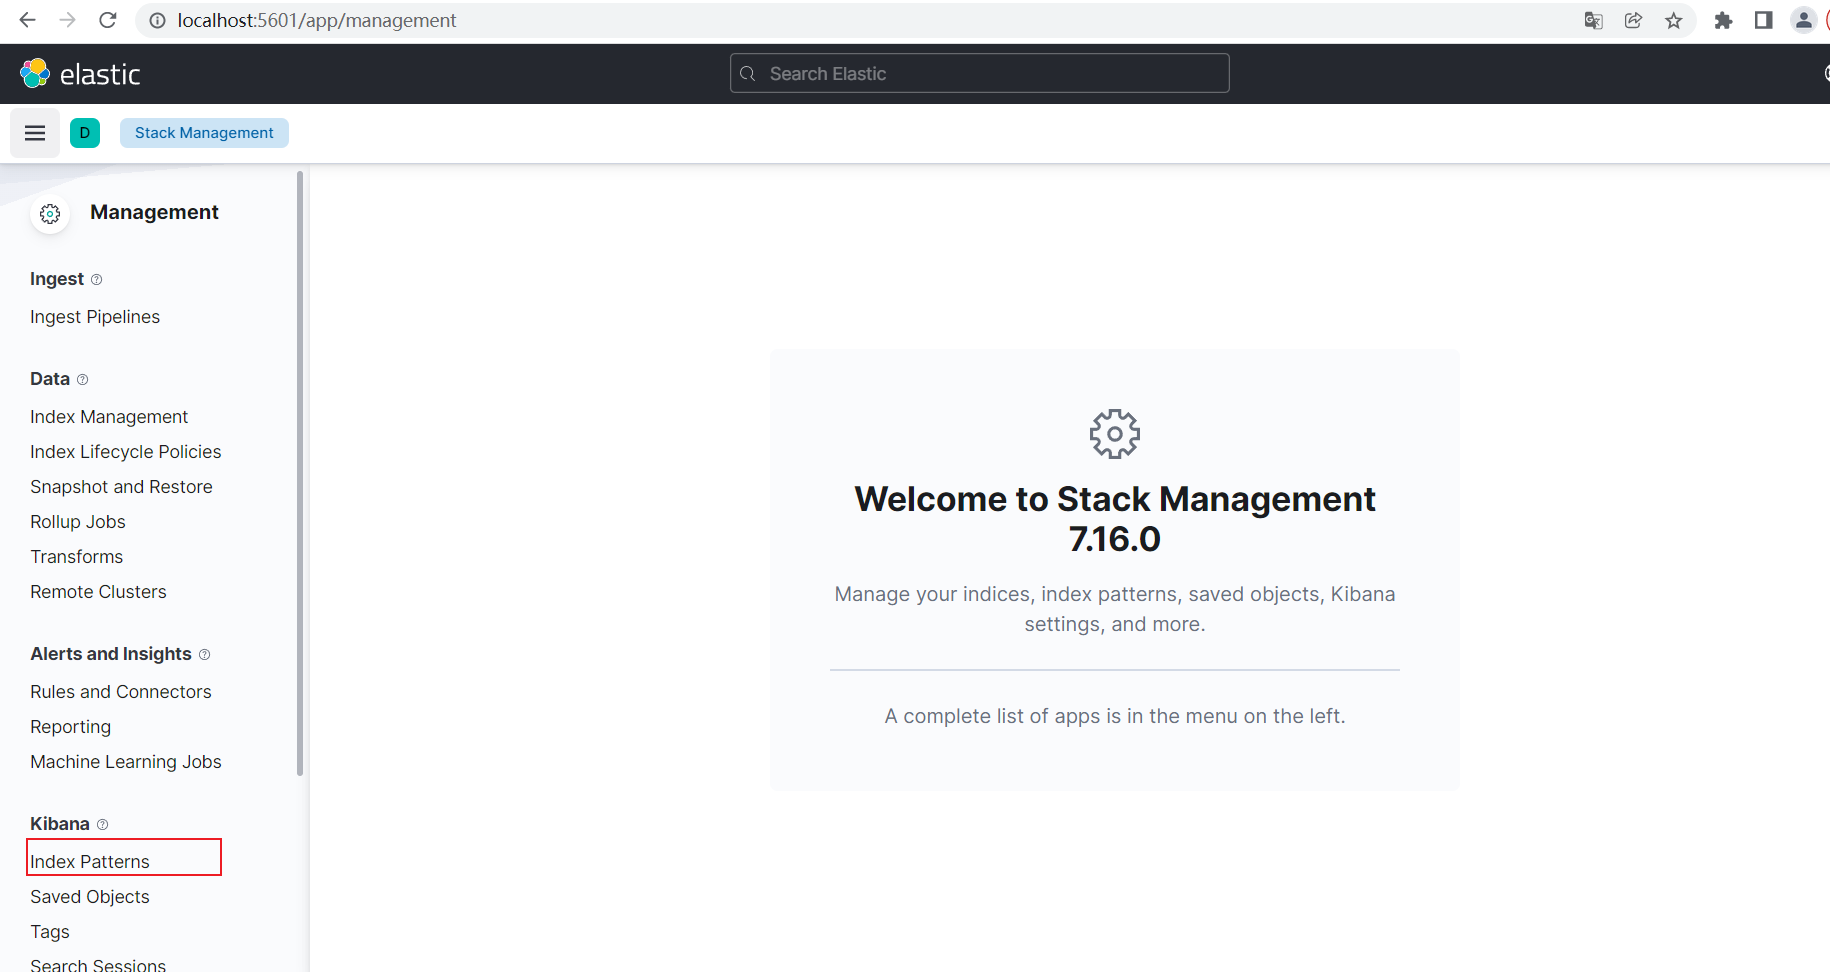
通过界面查看和索引日志数据
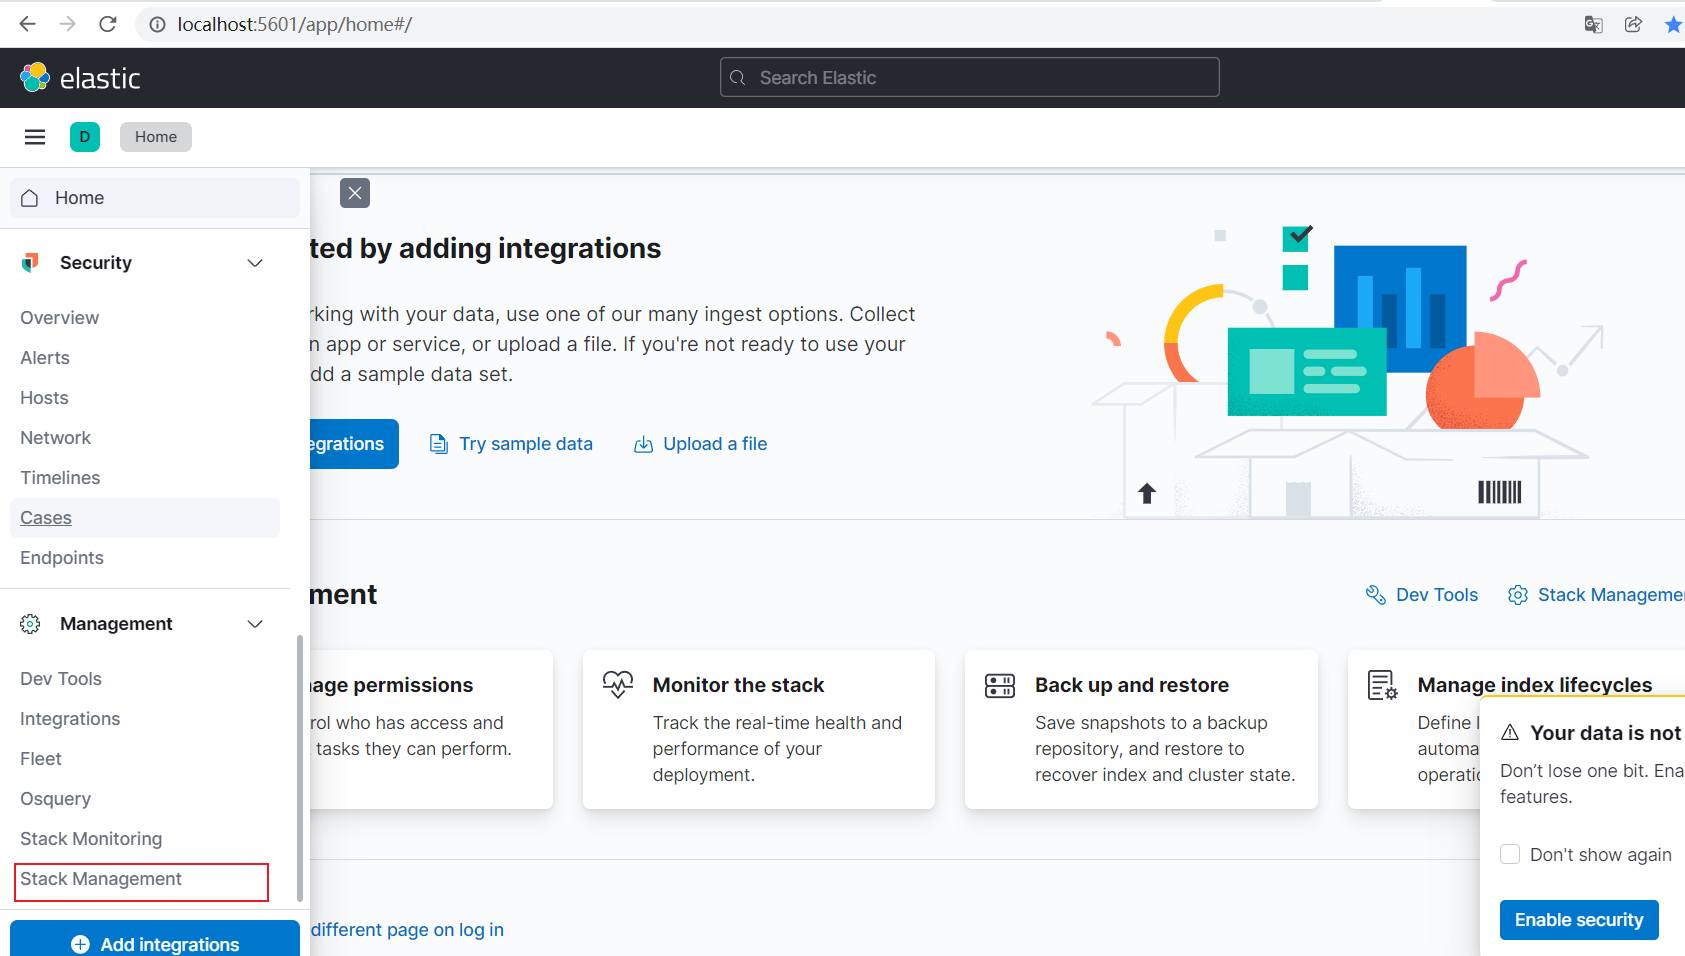
点击Stack Management
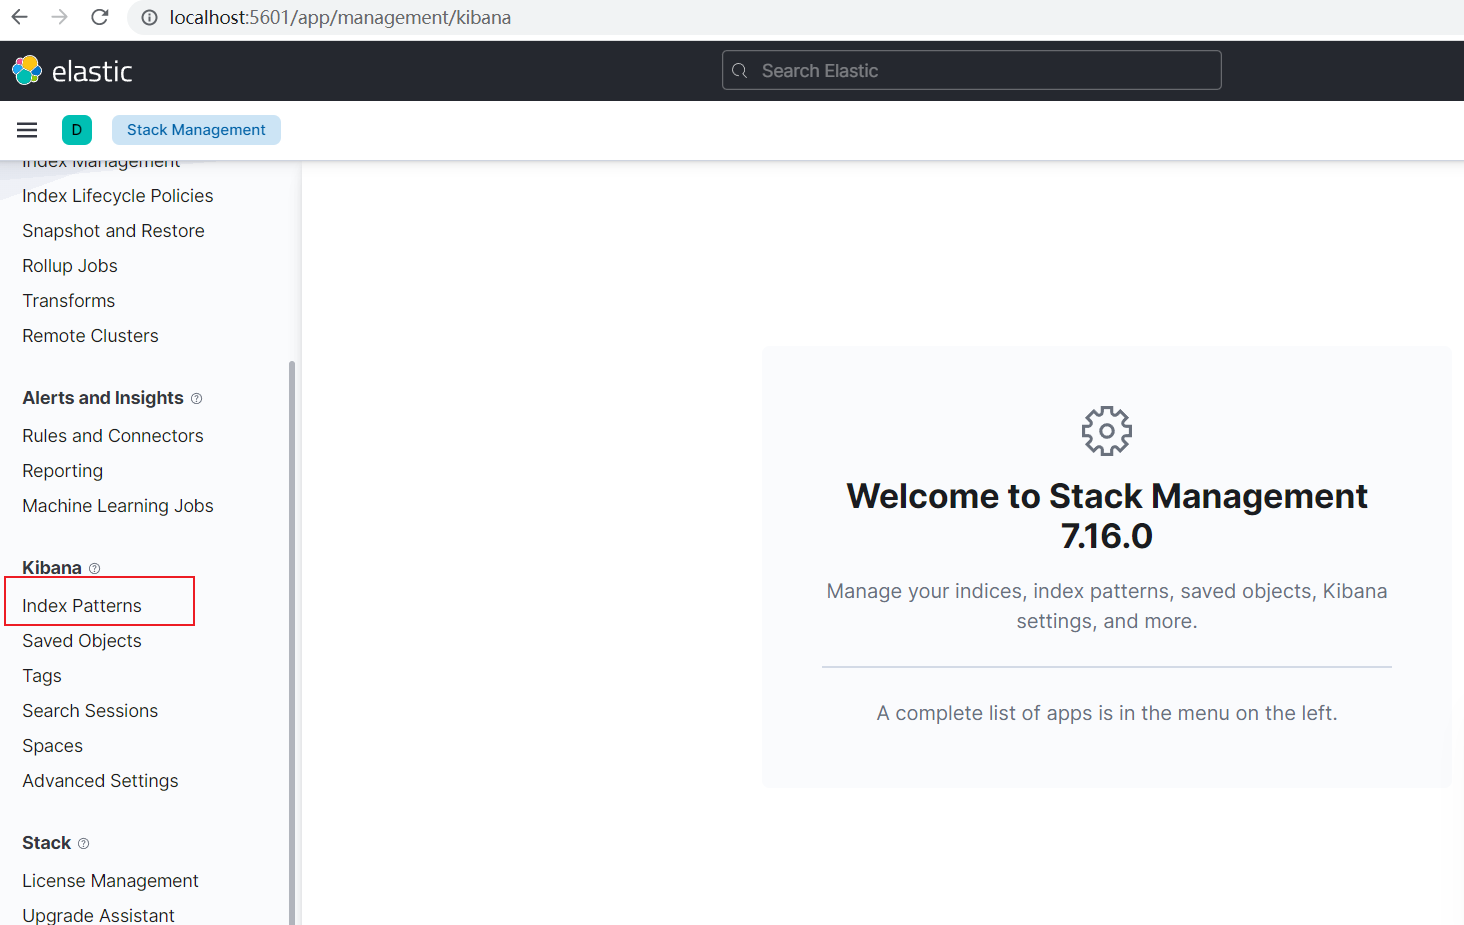
选择Index Patterns
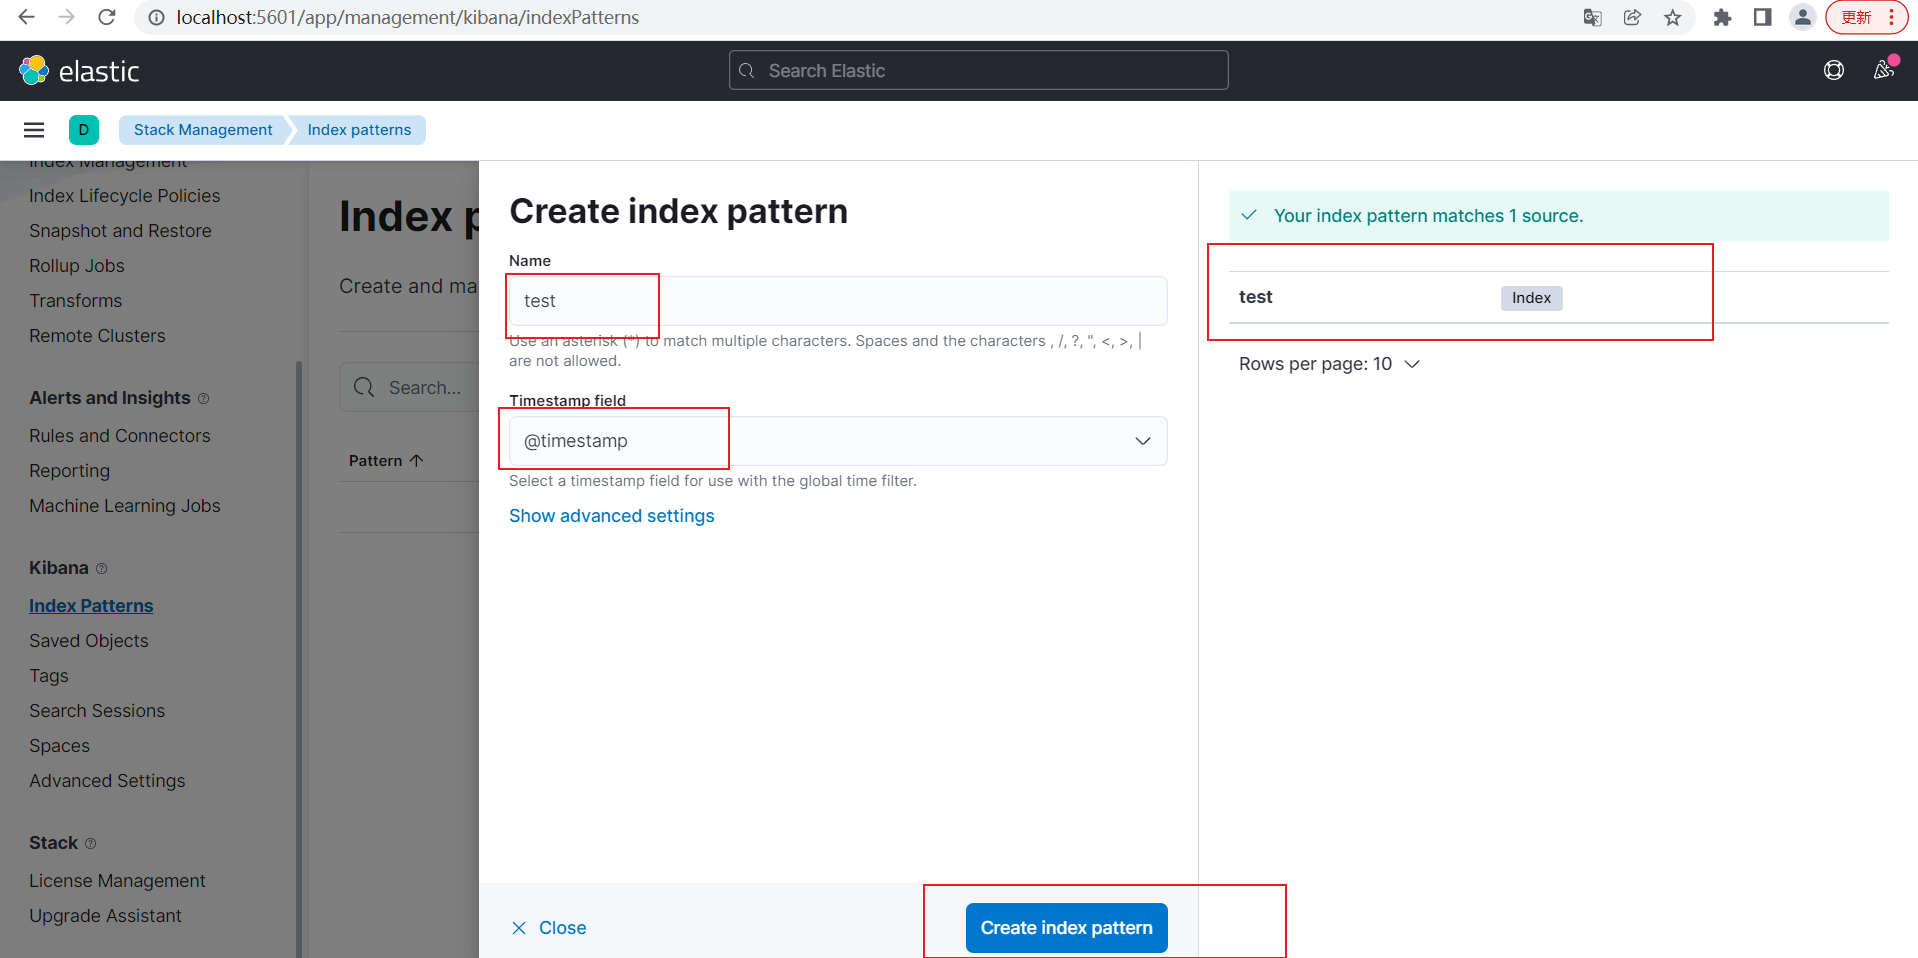
输入索引名称test,可以看到有匹配的,选择时间字段为@timestamp,点击Create Index pattern
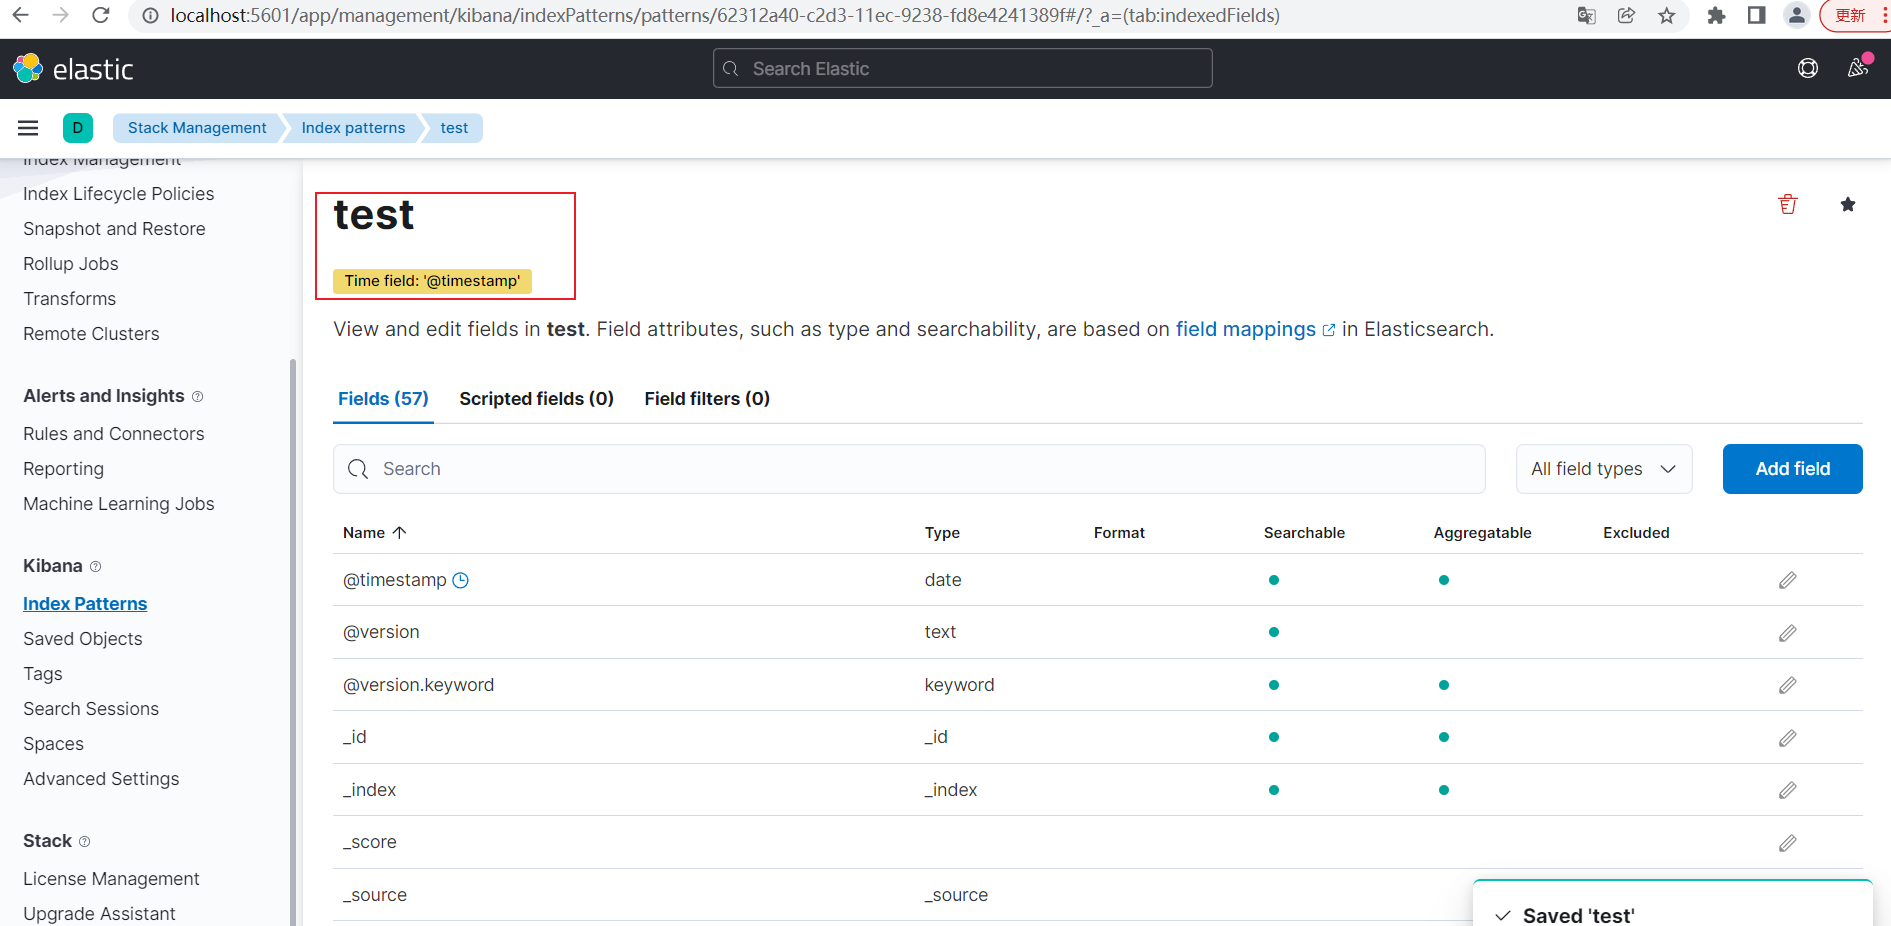
看到创建成功
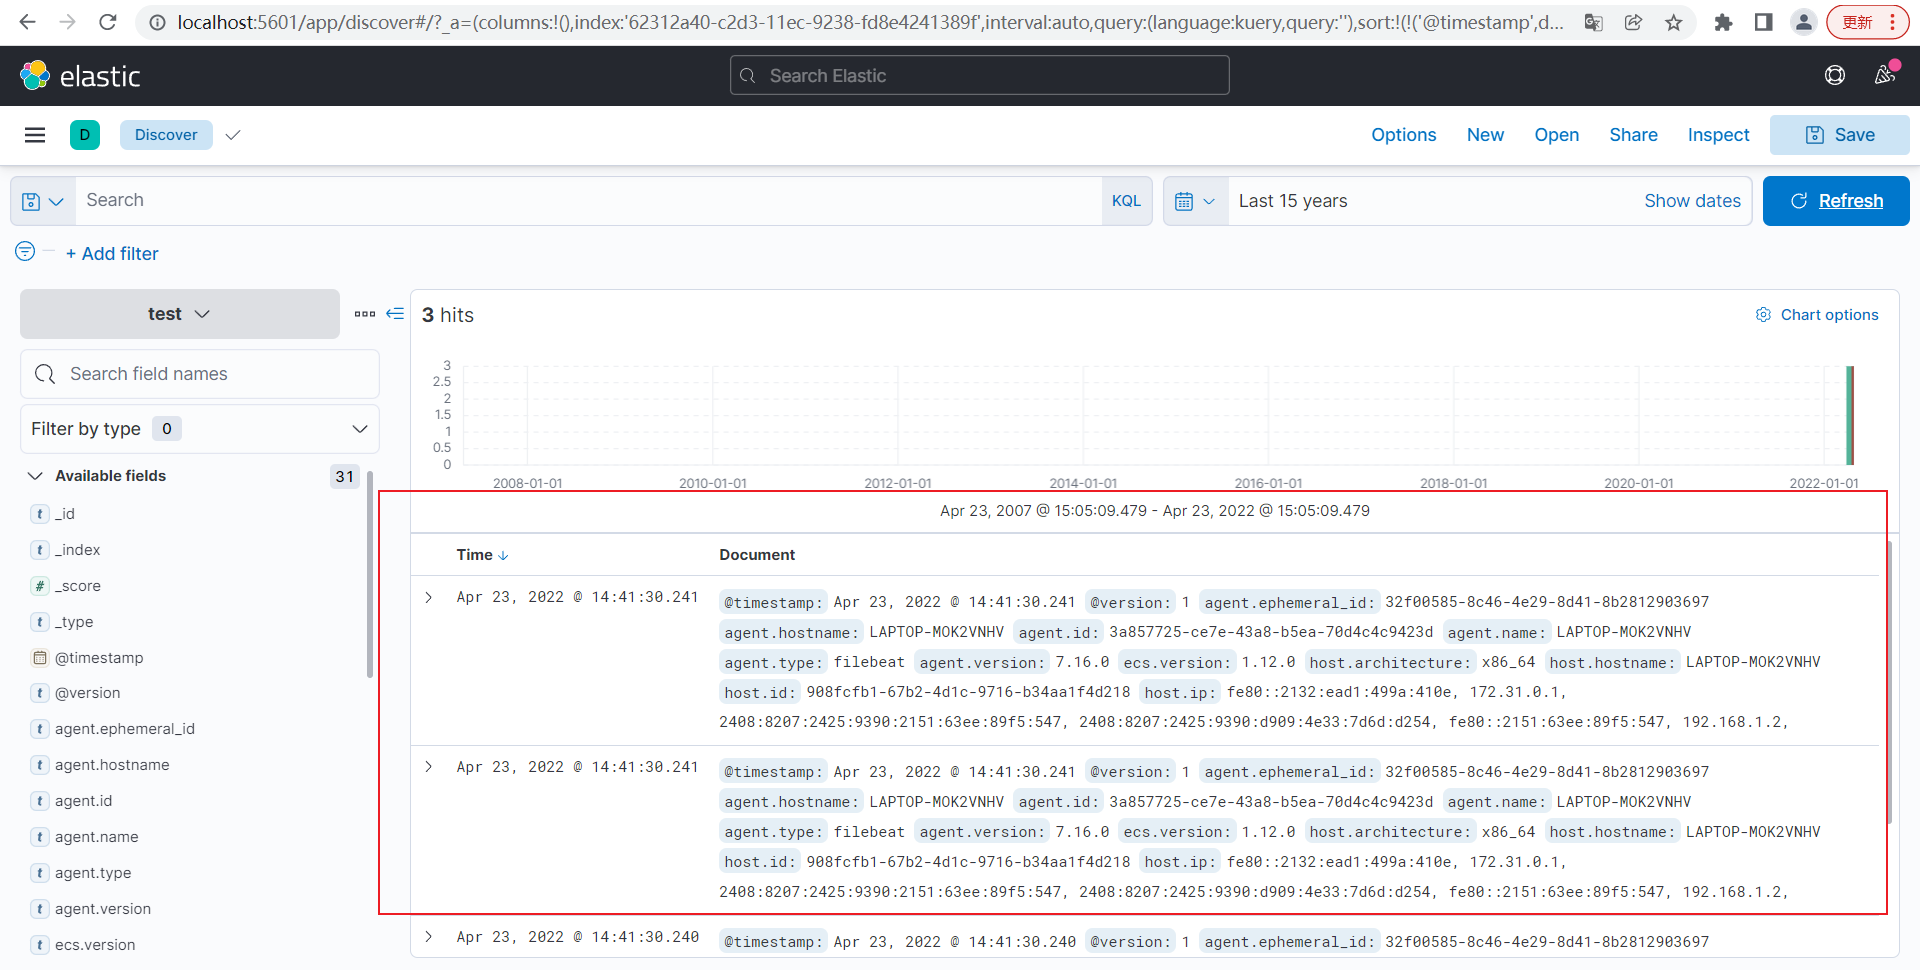
选择Discover
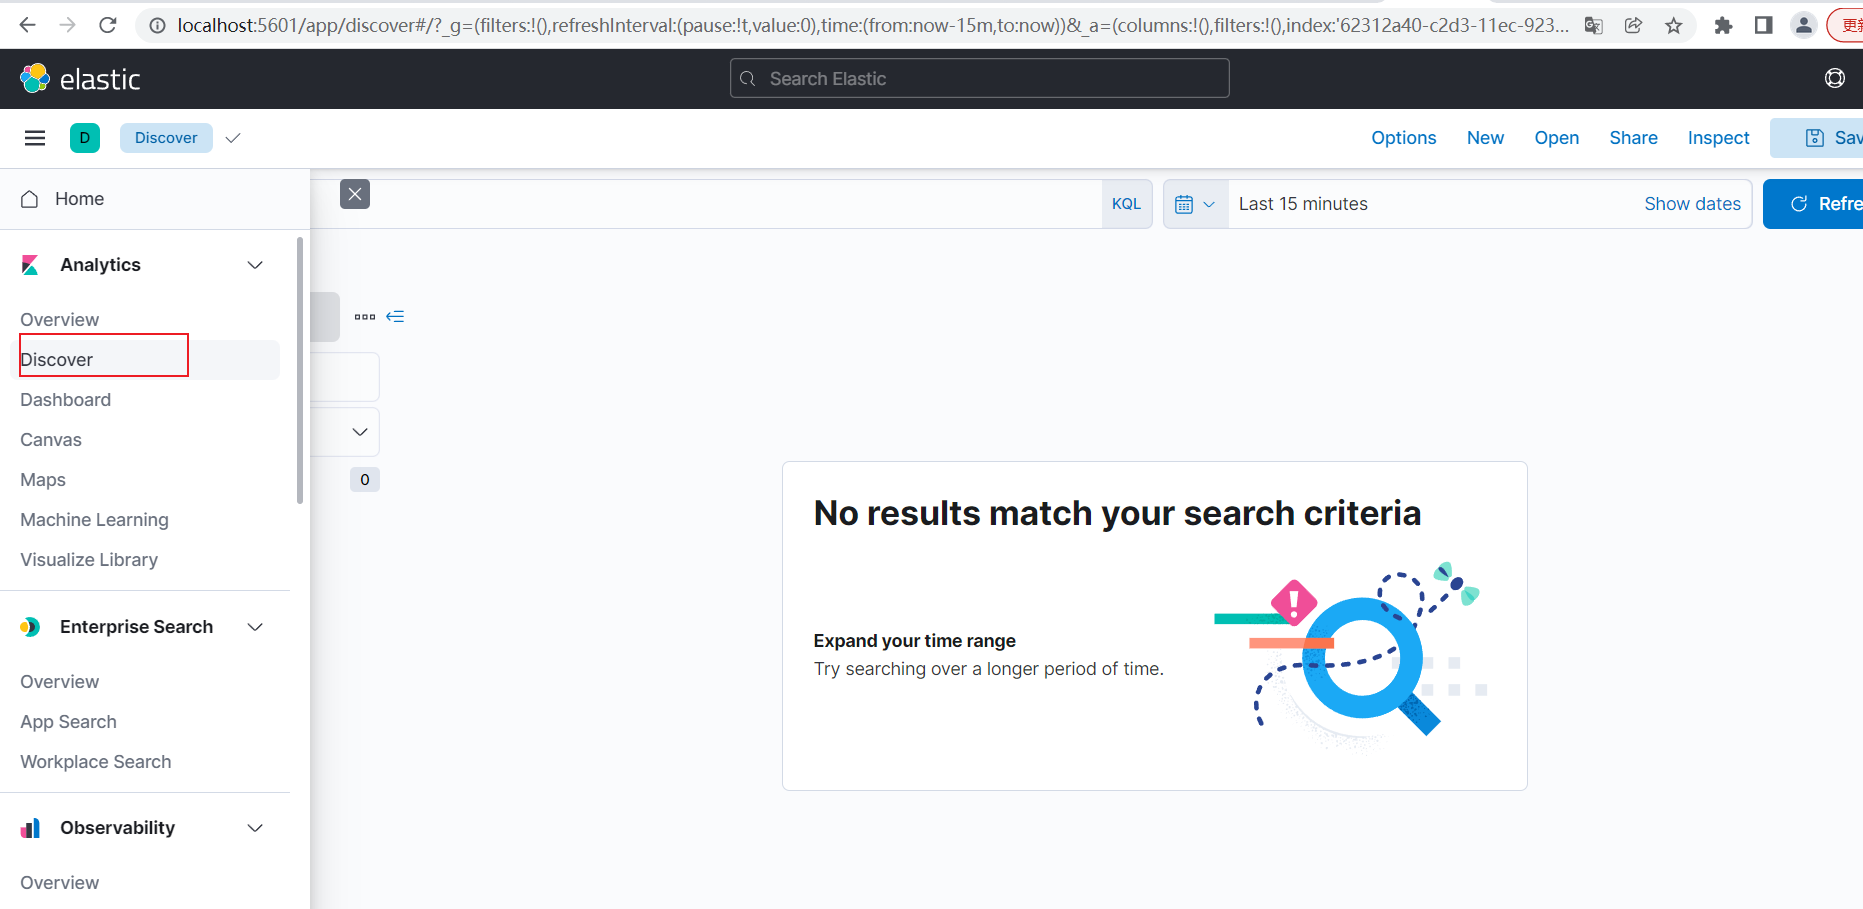
可以看到默认为test索引
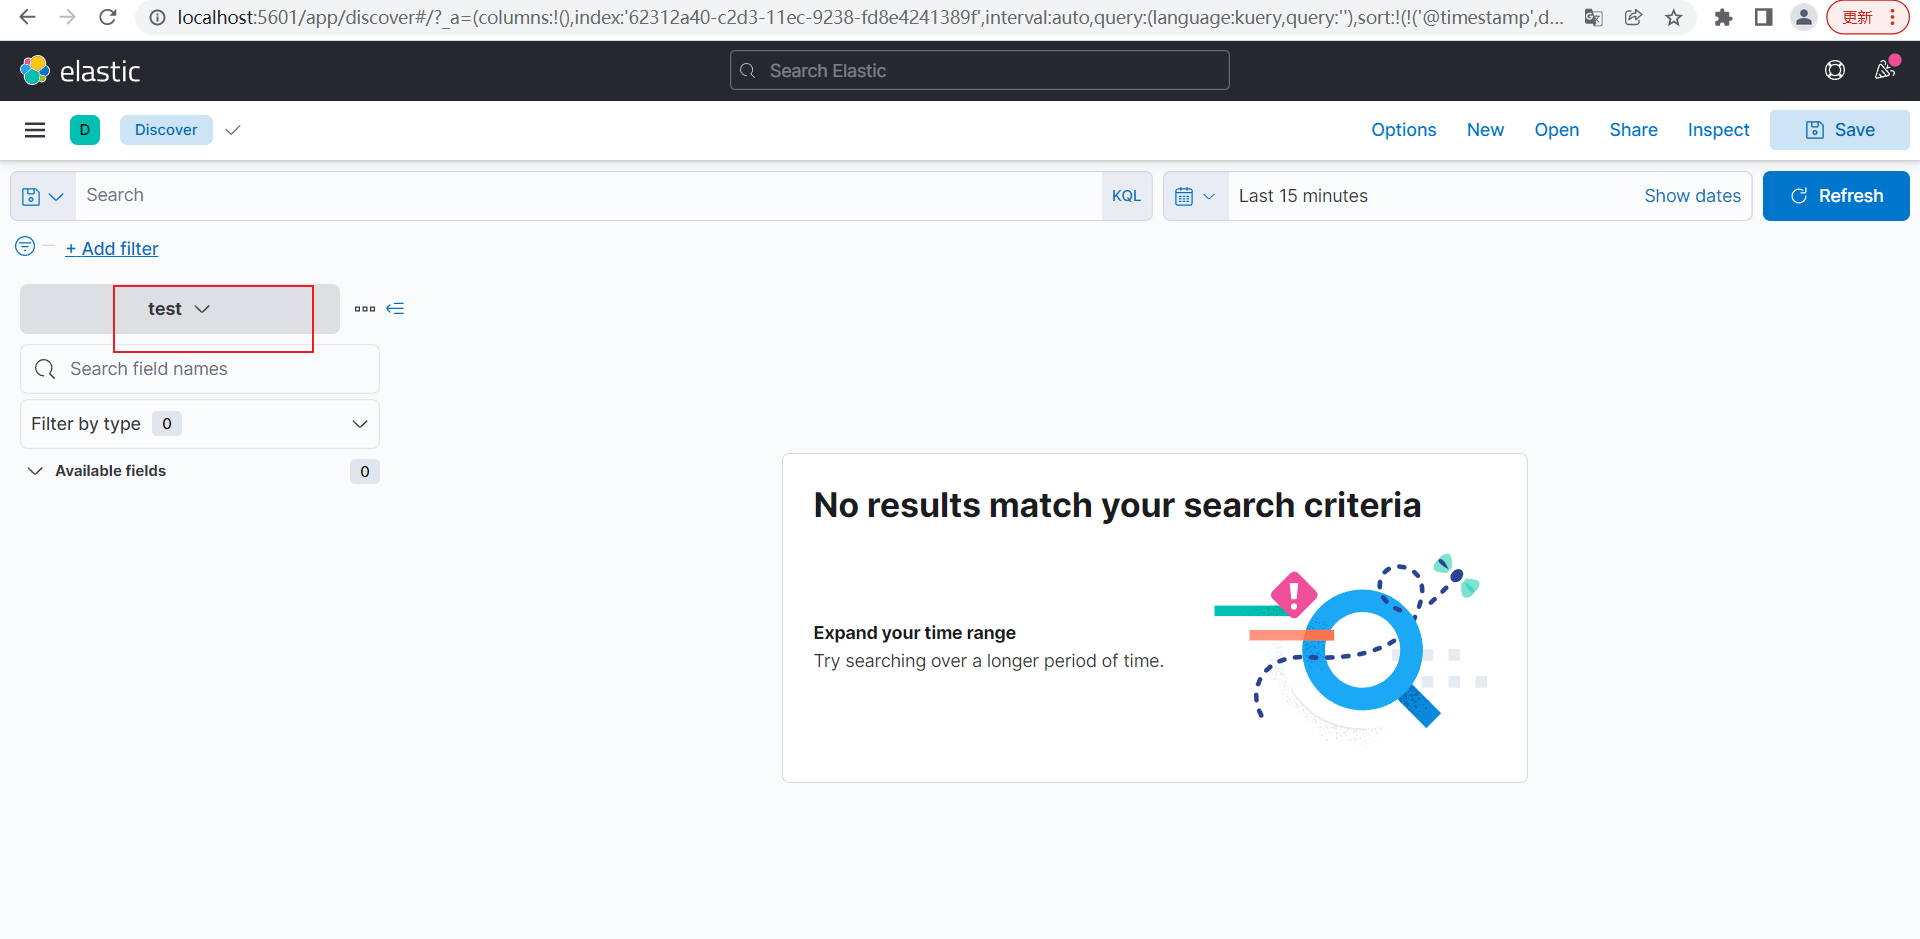
选择时间范围大一点
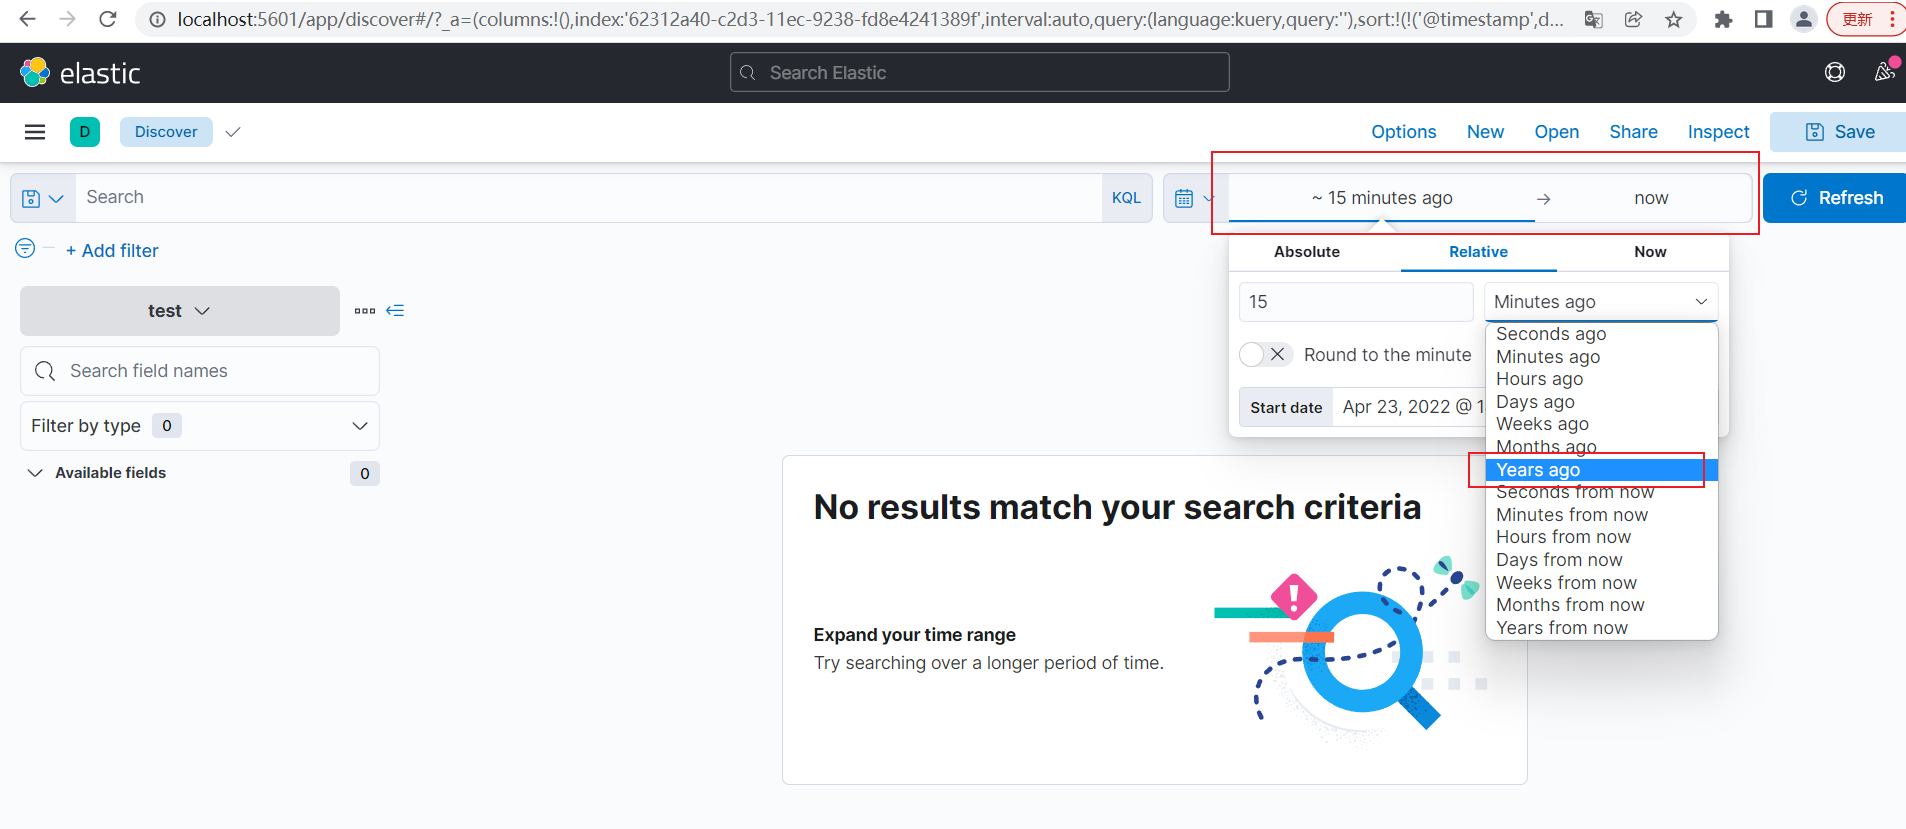
点击Update
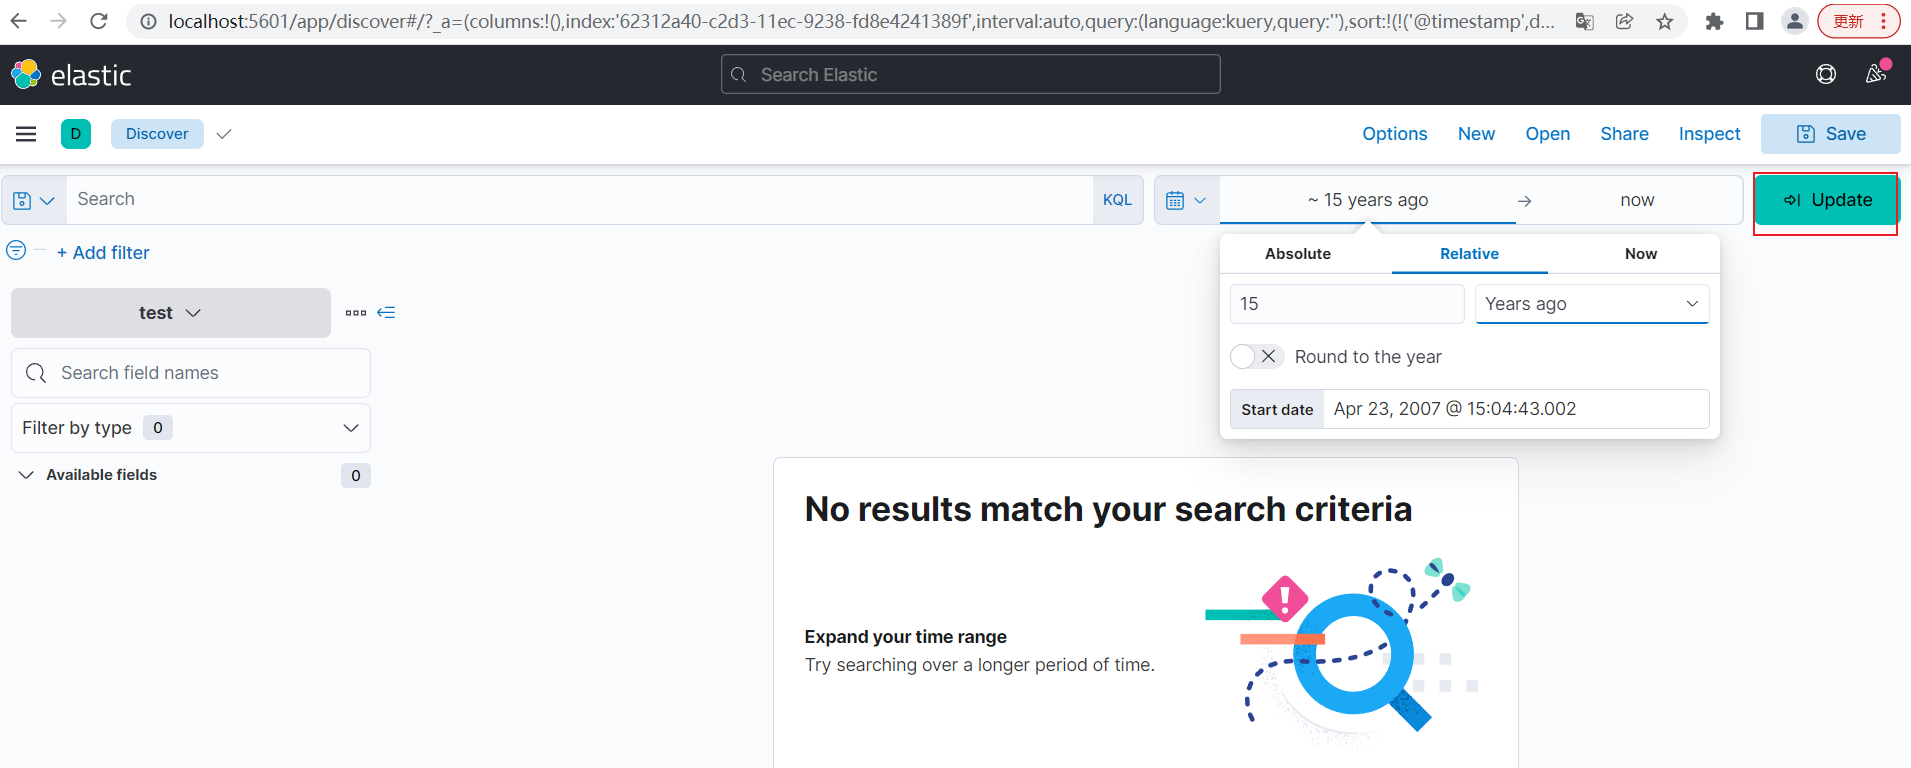
可以看到数据完全被加载出来
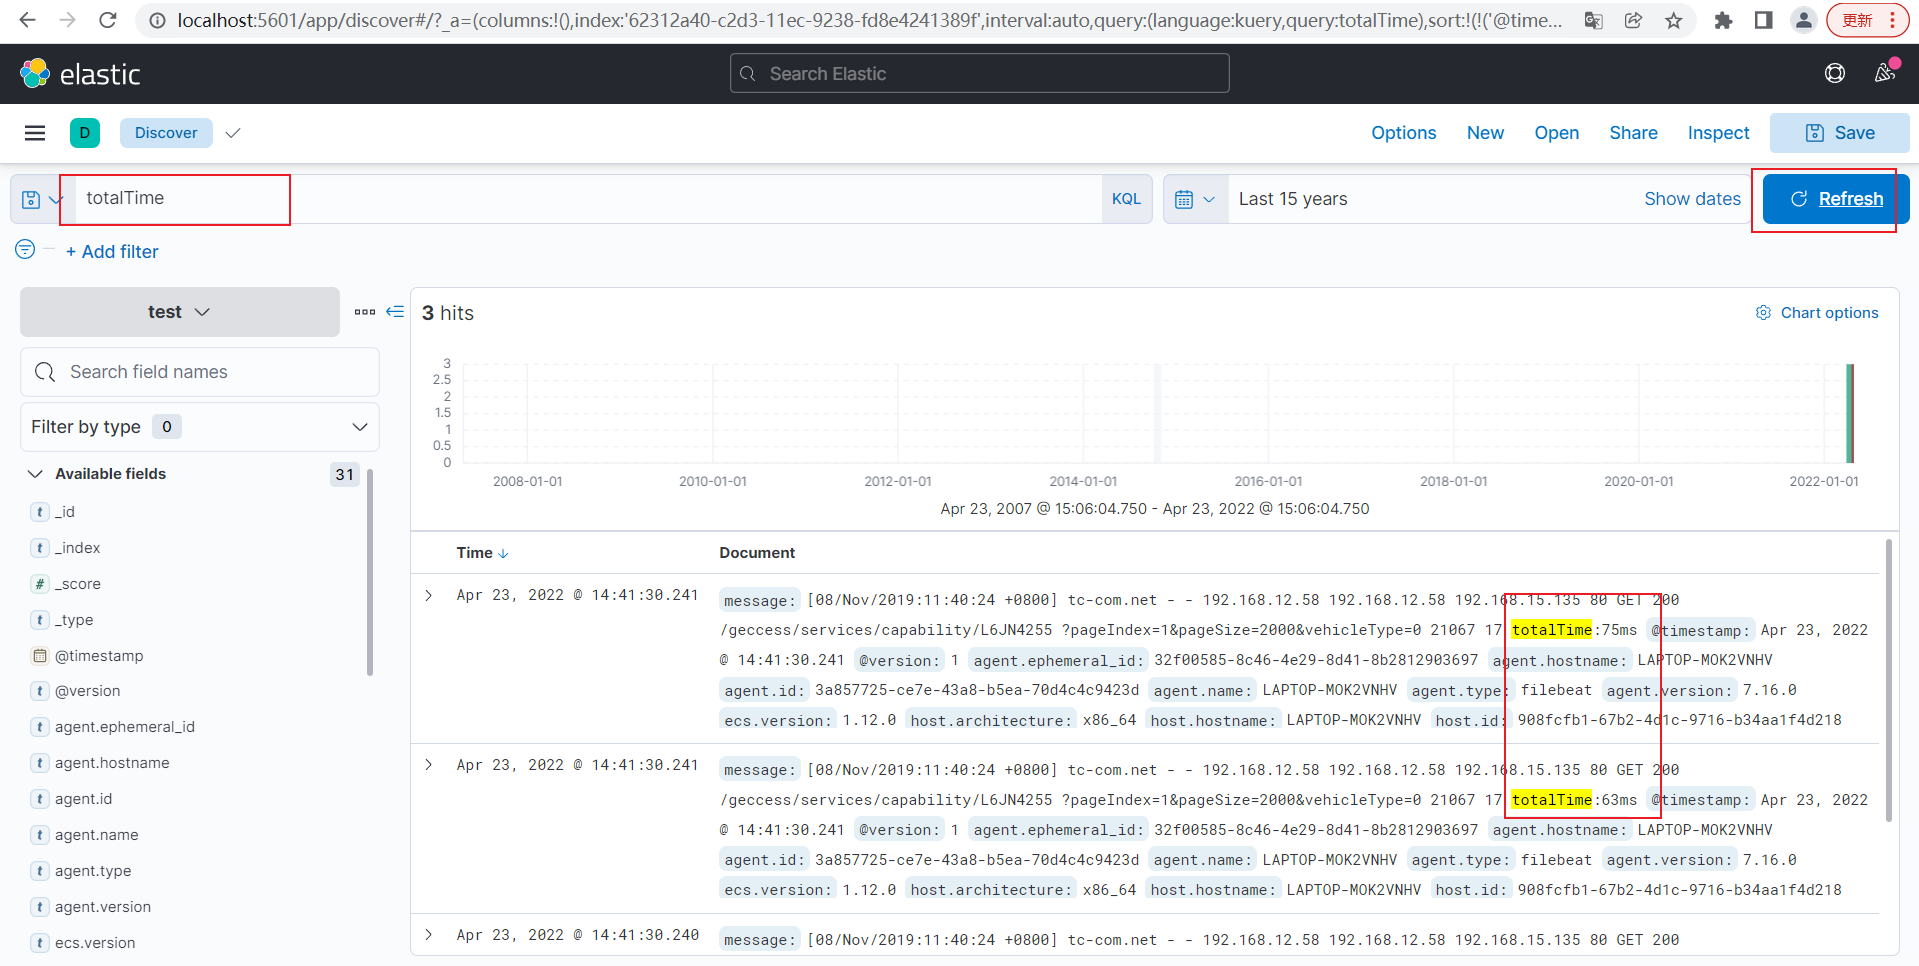
通过关键词totalTime搜索,点击Refresh,可以看到下面搜索高量的部分
提取日志中关键信息
日志文件
data.log日志文件内容修改如下:
1 | {"timestamp":"2022-05-06T17:23:25.365+08:00", "message":"tc-com.net - - 192.168.12.58 192.168.12.58 192.168.15.135 80 GET 200 /geccess/services/capability/L6JN4255 ?pageIndex=1&pageSize=2000&vehicleType=0 21067 17 totalTime:54ms"} |

logstash 日志解析测试
进入到
1 | F:\soft\elk\logstash-7.16.0-windows-x86_64\logstash-7.16.0\config\ |
时间戳解析测试
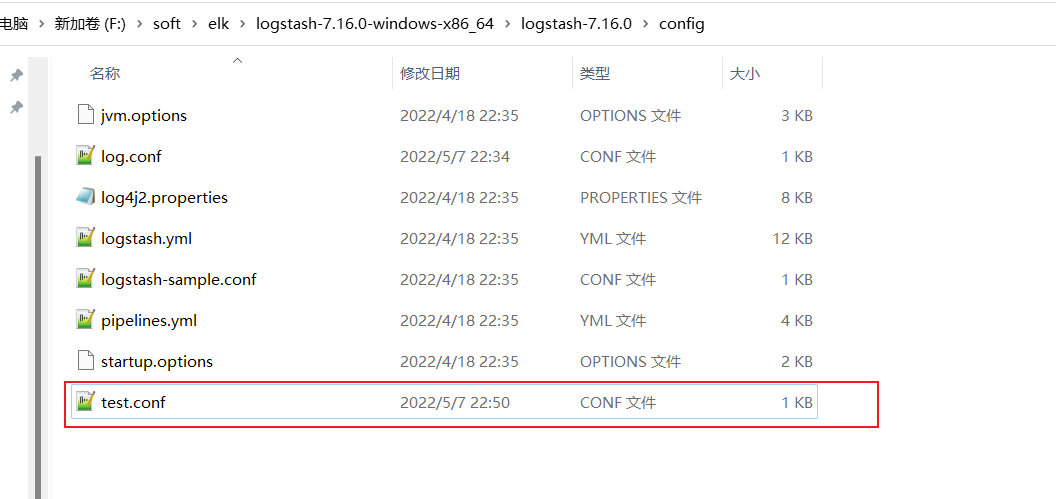
在logstash配置文件中,新增文件名test.conf
test.conf内容如下,将时间戳保存为tmpTime字段,将转化成@timestamp
1 | input{ |
启动新的shell,并执行命令
1 | cd F:\soft\elk |
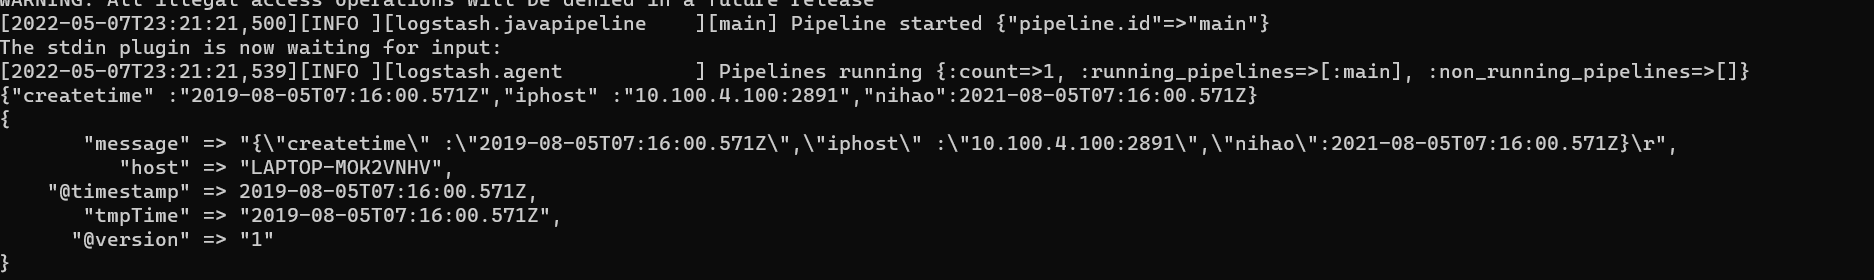
输入参数
1 | {"createtime" :"2019-08-05T07:16:00.571Z","iphost" :"10.100.4.100:2891","nihao":2021-08-05T07:16:00.571Z} |
可以看到时间戳解析成功
关键字解析测试
test.conf内容修改如下:
1 | input{ |
启动新的shell,并执行命令
1 | cd F:\soft\elk |
输入参数
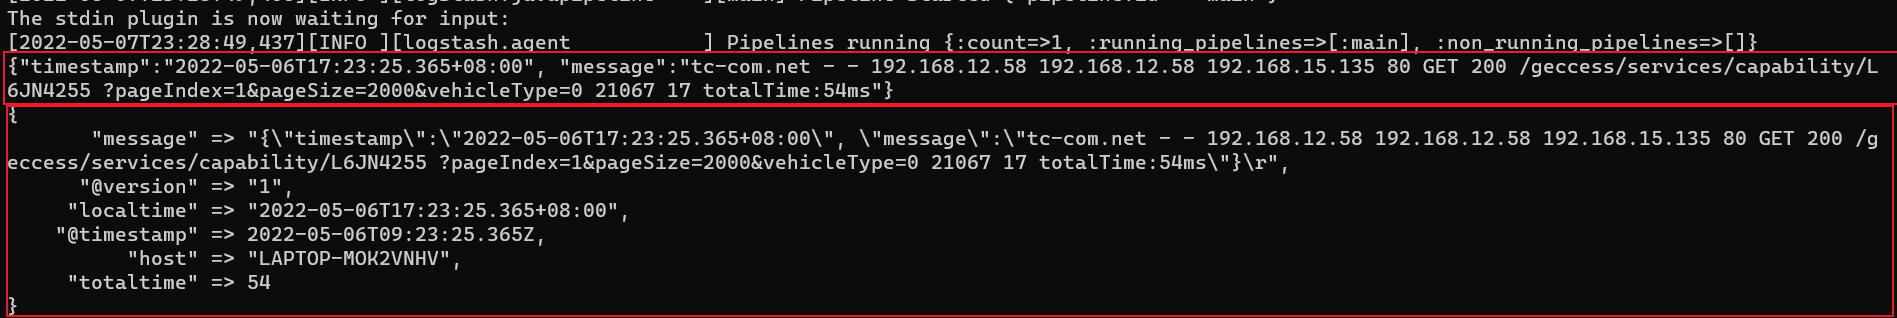
1 | {"timestamp":"2022-05-06T17:23:25.365+08:00", "message":"tc-com.net - - 192.168.12.58 192.168.12.58 192.168.15.135 80 GET 200 /geccess/services/capability/L6JN4255 ?pageIndex=1&pageSize=2000&vehicleType=0 21067 17 totalTime:54ms"} |
可以看到时间戳解析成功
过滤器丢日志测试
test.conf内容修改如下:
1 | input{ |
启动新的shell,并执行命令
1 | cd F:\soft\elk |
输入参数
1 | {"timestamp":"2022-05-06T17:23:25.365+08:00", "message":"tc-com.net - - 192.168.12.58 192.168.12.58 192.168.15.135 80 GET 200 /geccess/services/capability/L6JN4255 ?pageIndex=1&pageSize=2000&vehicleType=0 21067 17 atotalTime:54ms"} |
然后输入这个参数
1 | {"timestamp":"2022-05-06T17:23:25.365+08:00", "message":"tc-com.net - - 192.168.12.58 192.168.12.58 192.168.15.135 80 GET 200 /geccess/services/capability/L6JN4255 ?pageIndex=1&pageSize=2000&vehicleType=0 21067 17 totalTime:54ms"} |
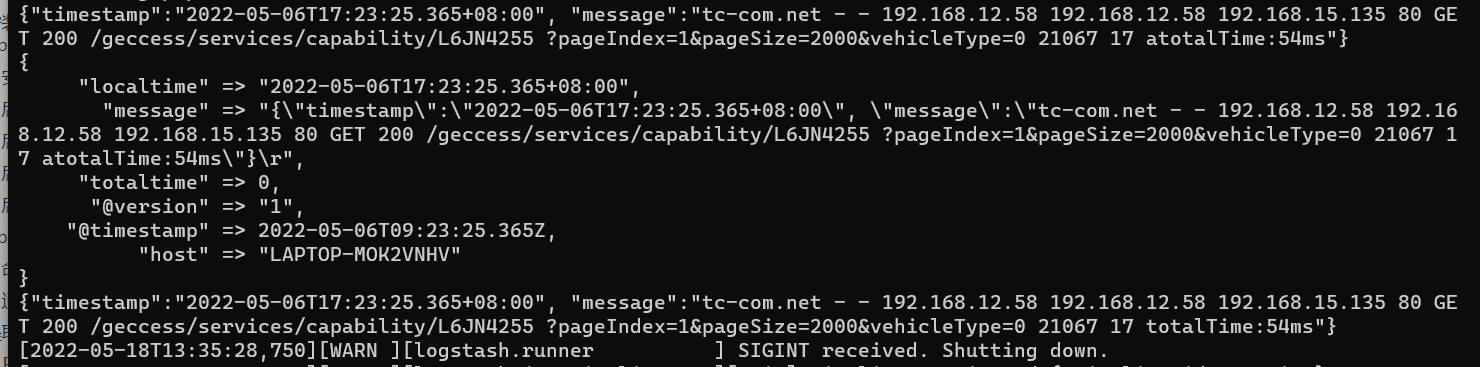
可以看到消息有atotalTime关键字的可以被解析
logstash配置文件
log.conf修改如下
1 | Sample Logstash configuration for creating a simple |
启动elasticsearch、kibana、logstash
按照上文介绍的分别重新启动elasticsearch、kibana、logstash
启动filebeat
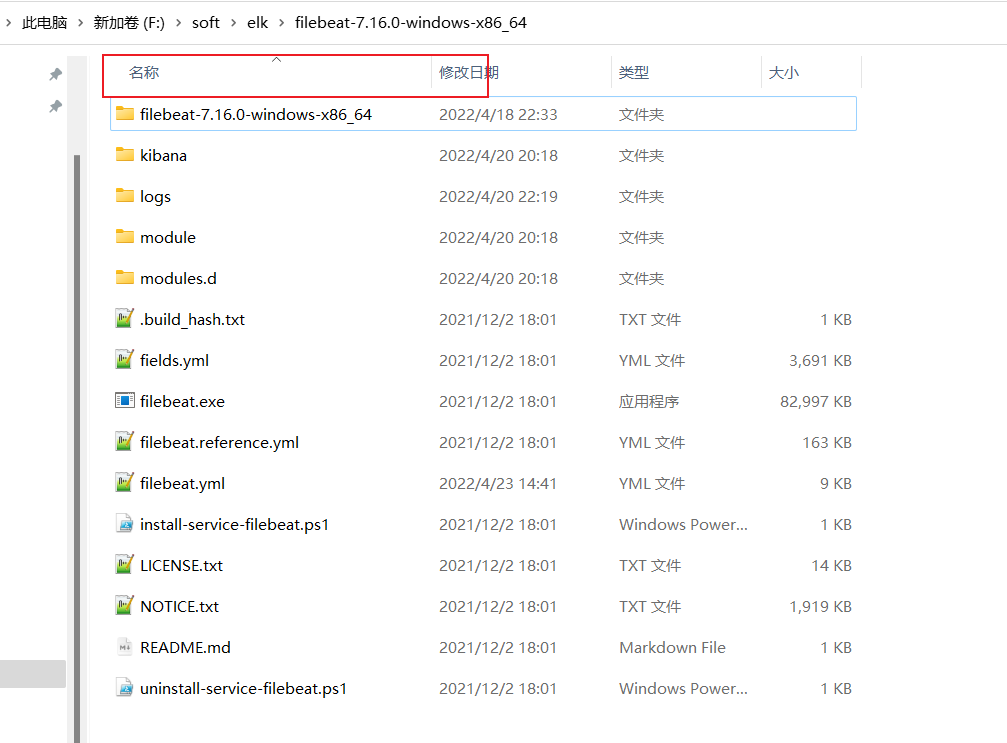
进入F:\soft\elk\filebeat-7.16.0-windows-x86_64
删除data文件目录,可以重新上传之前的日志文件
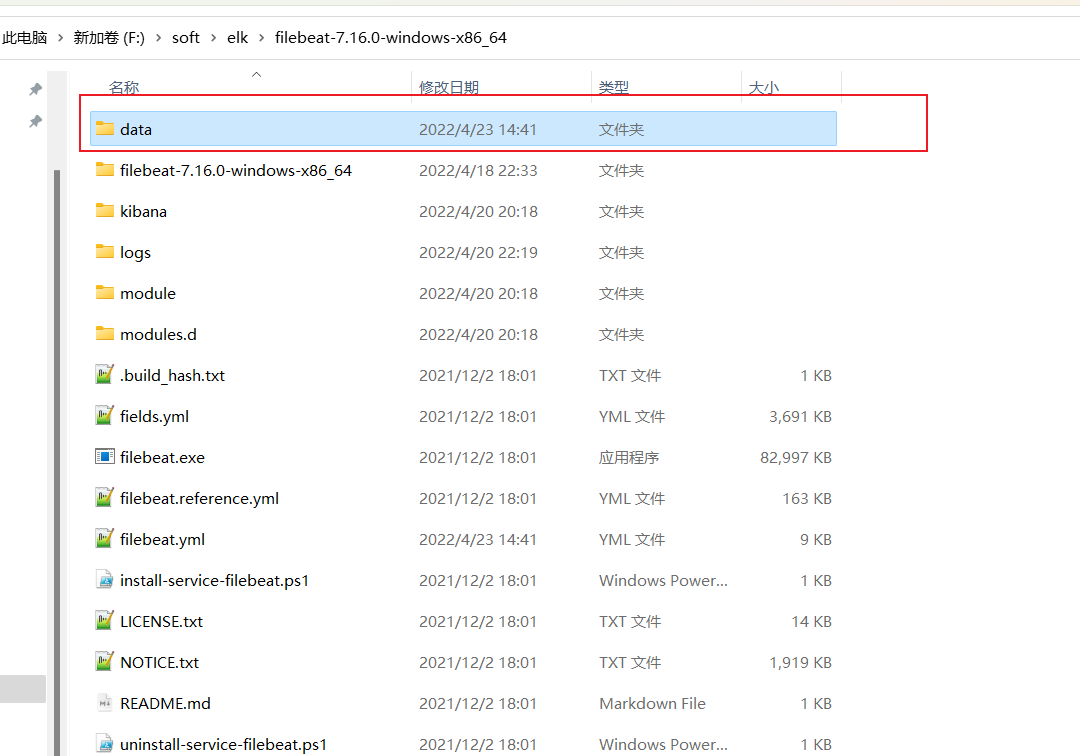
删除成功
然后按照上文启动filebeat
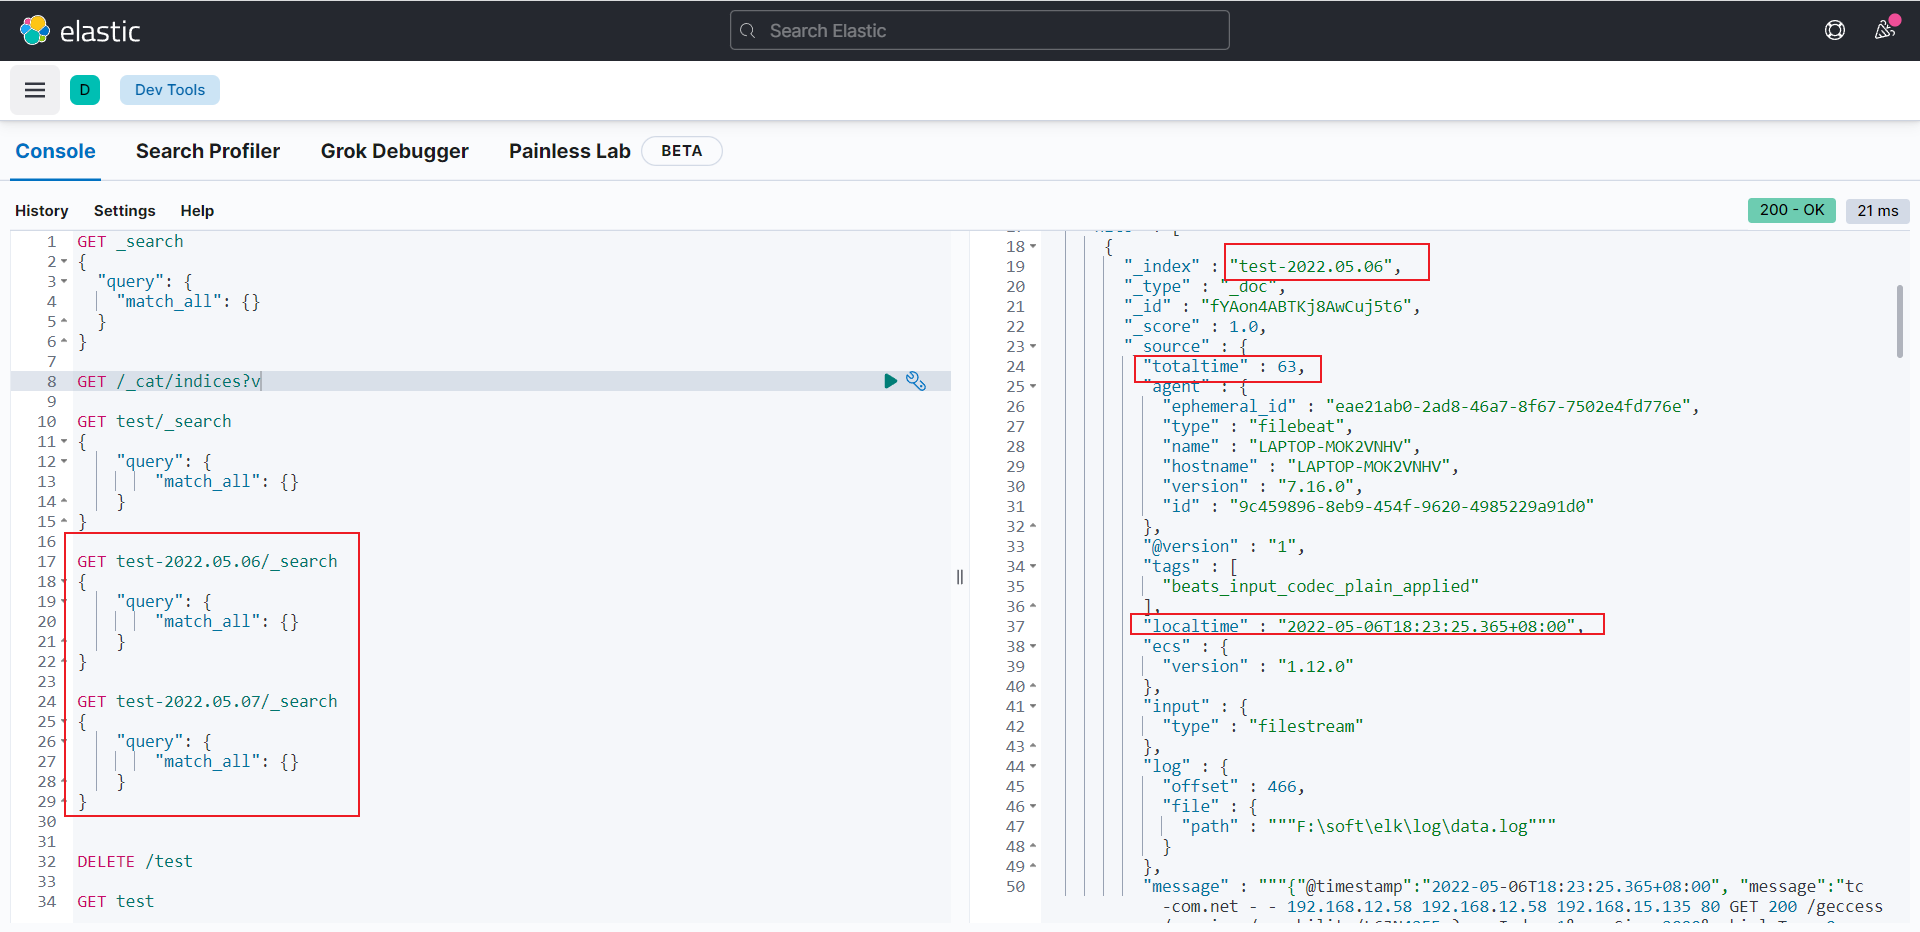
kibana Dev Tools查询创建的索引数据
打开Dev Tools
输入如下:
1 | GET test/_search |
分别执行查询,可以看到日志已经根据日期创建了两个索引,并且关键字和时间也正常解析出来了
kibana Discover查询创建的合并的日期索引数据
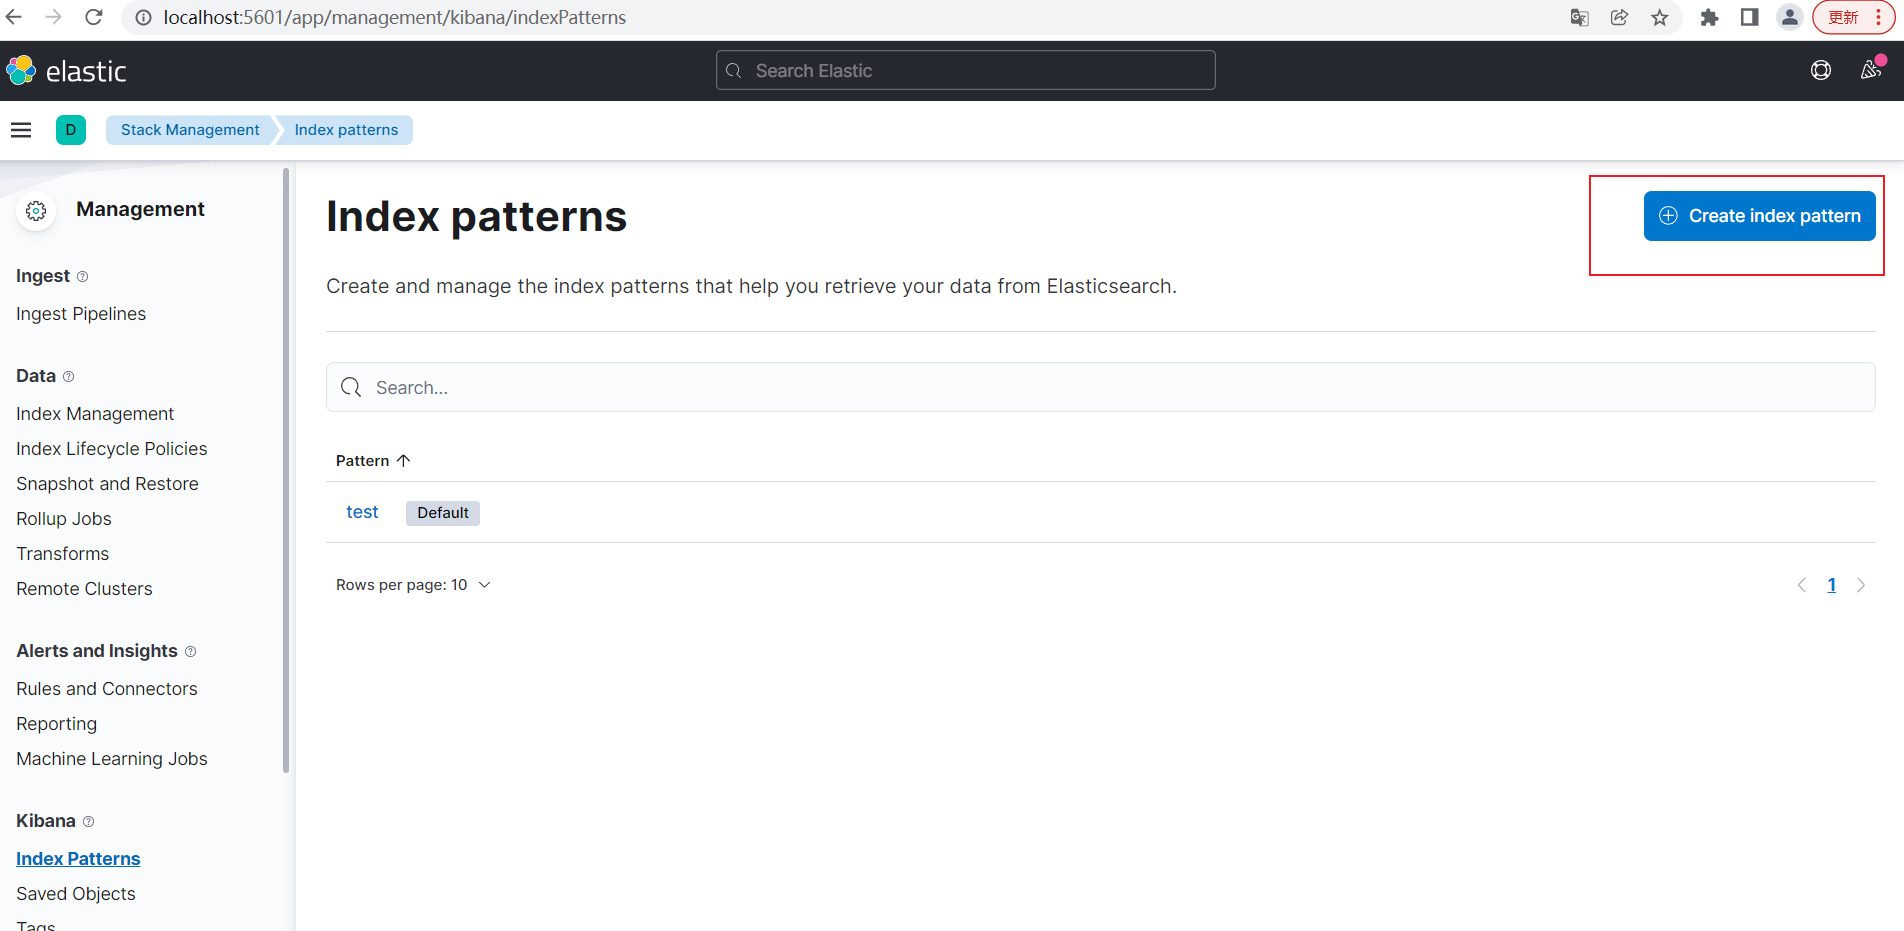
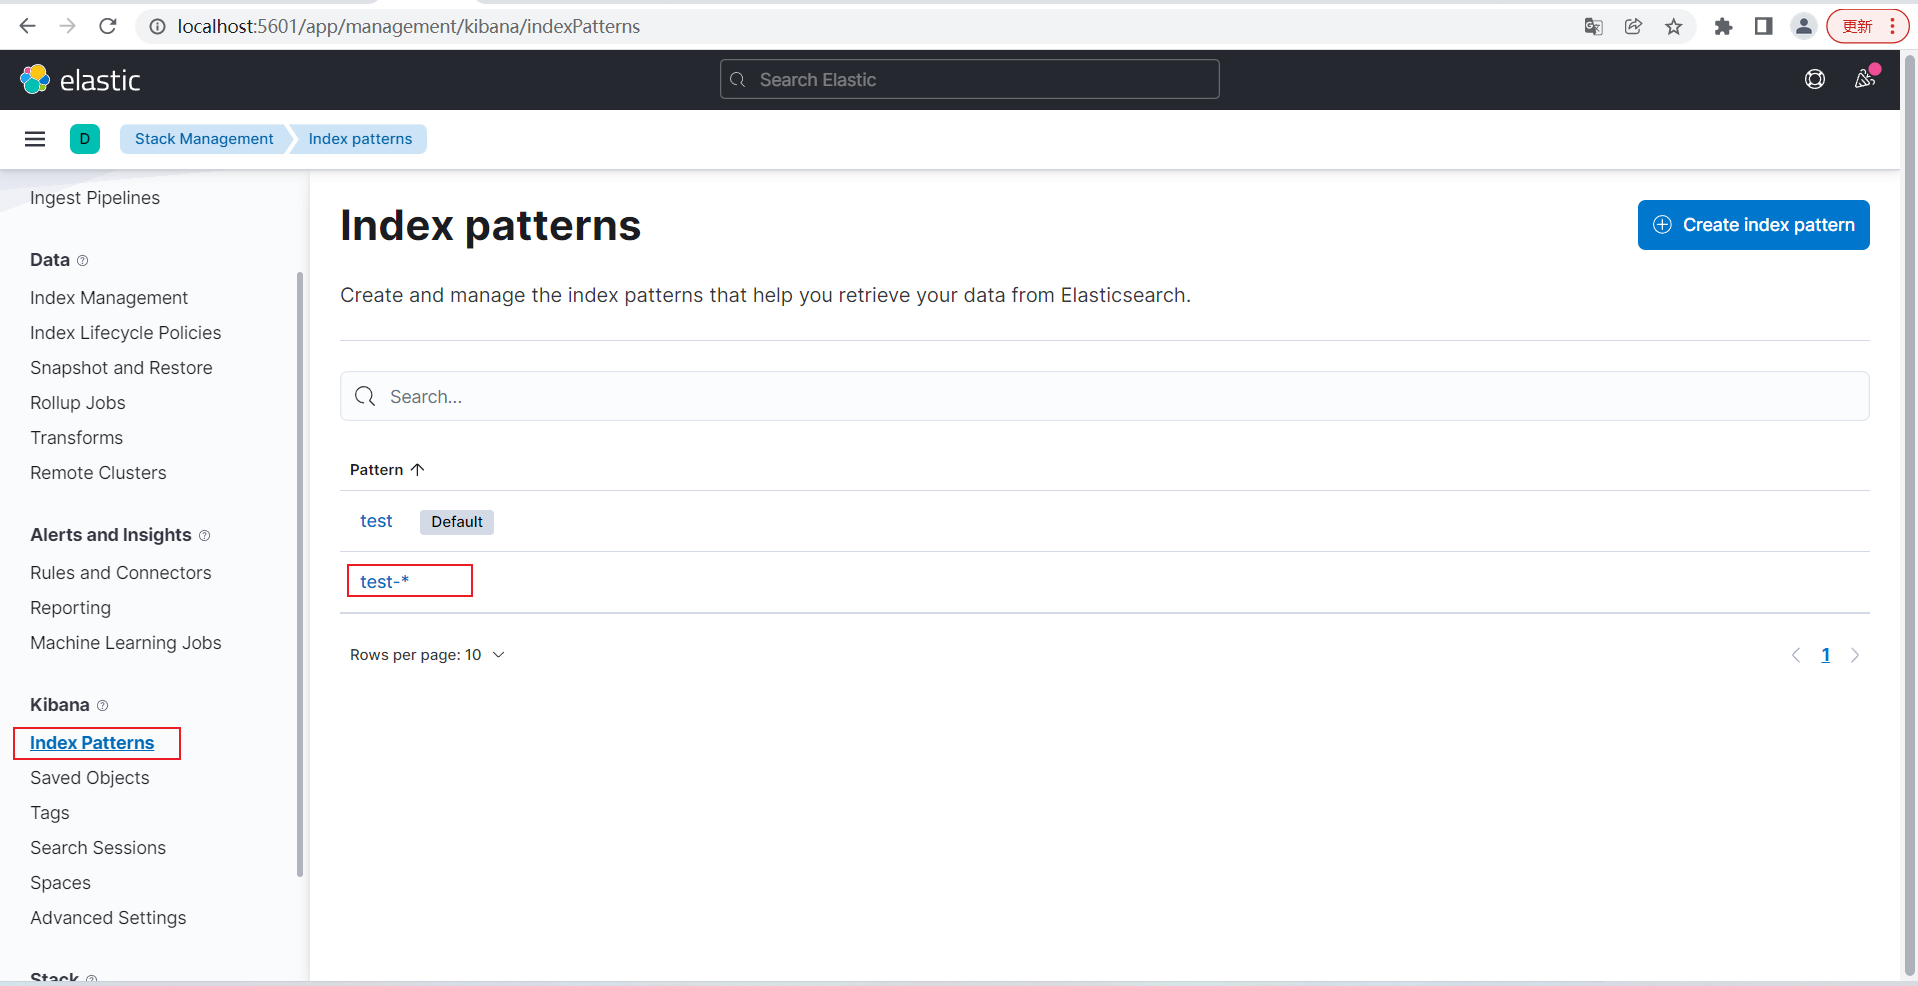
选择Stack Management
选择Index Patterns
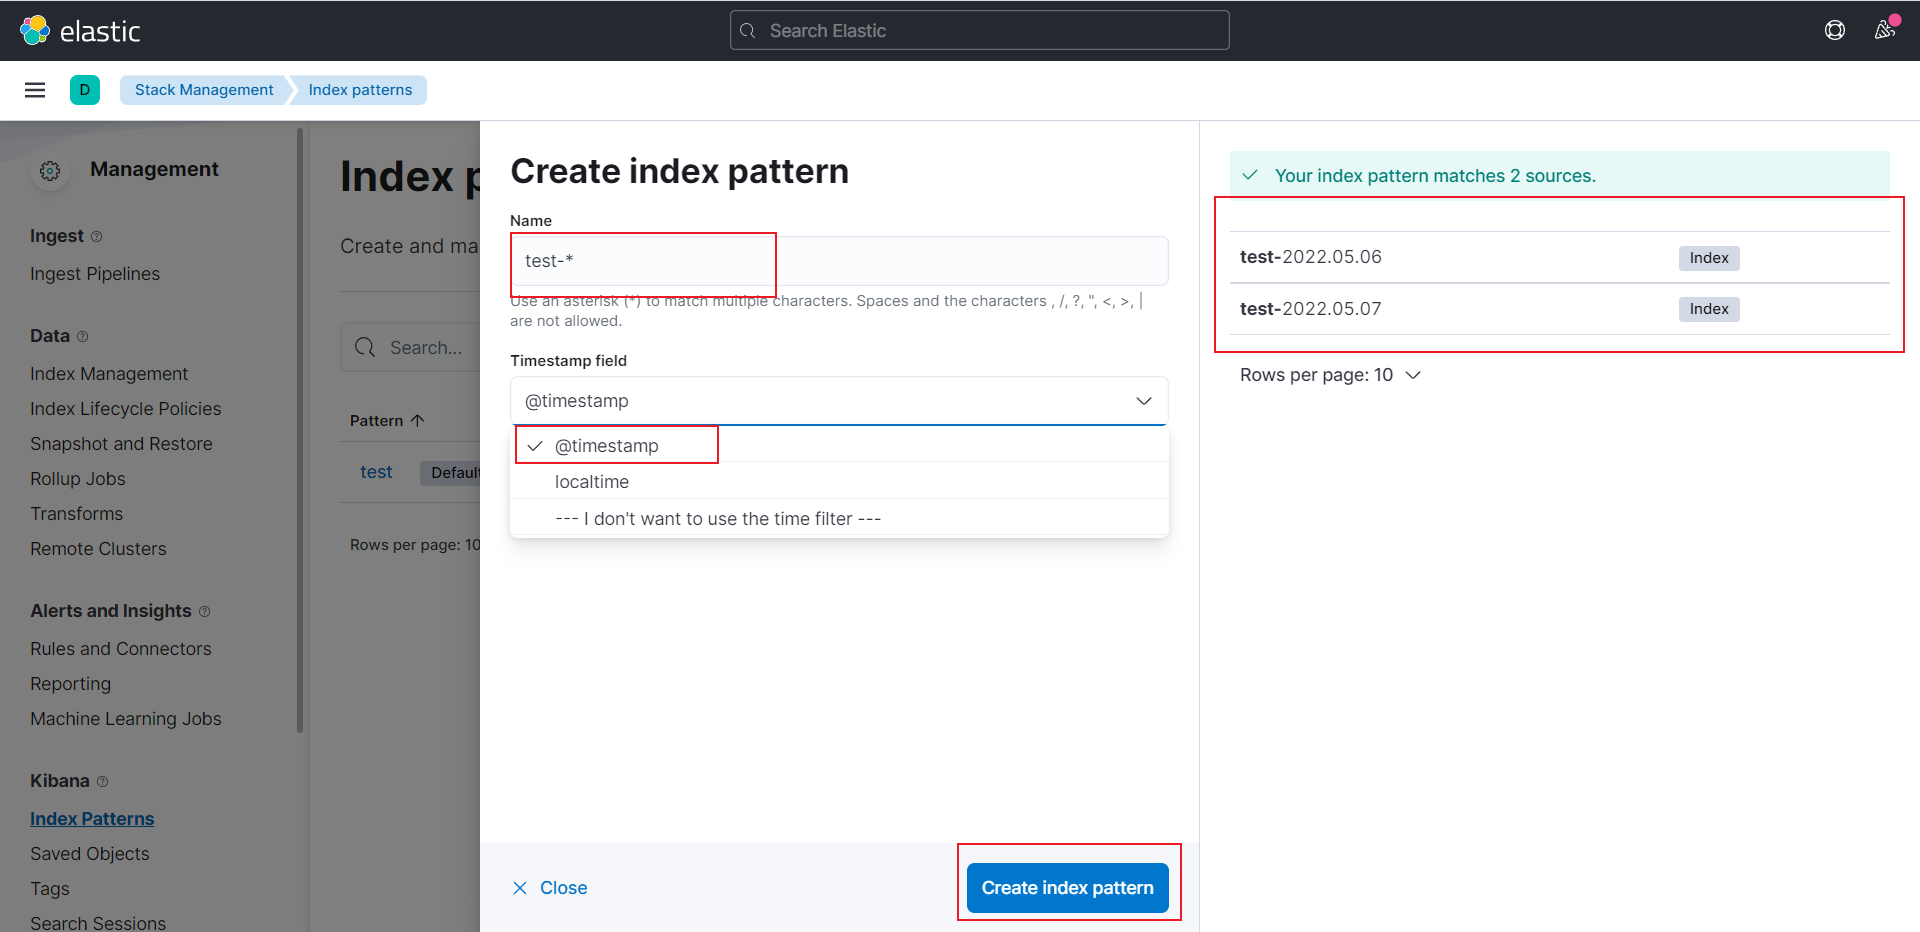
点击Create index pattern
Name为test-*,表示以test-为前缀的所有相关索引数据
Timestamp field选择@timestamp
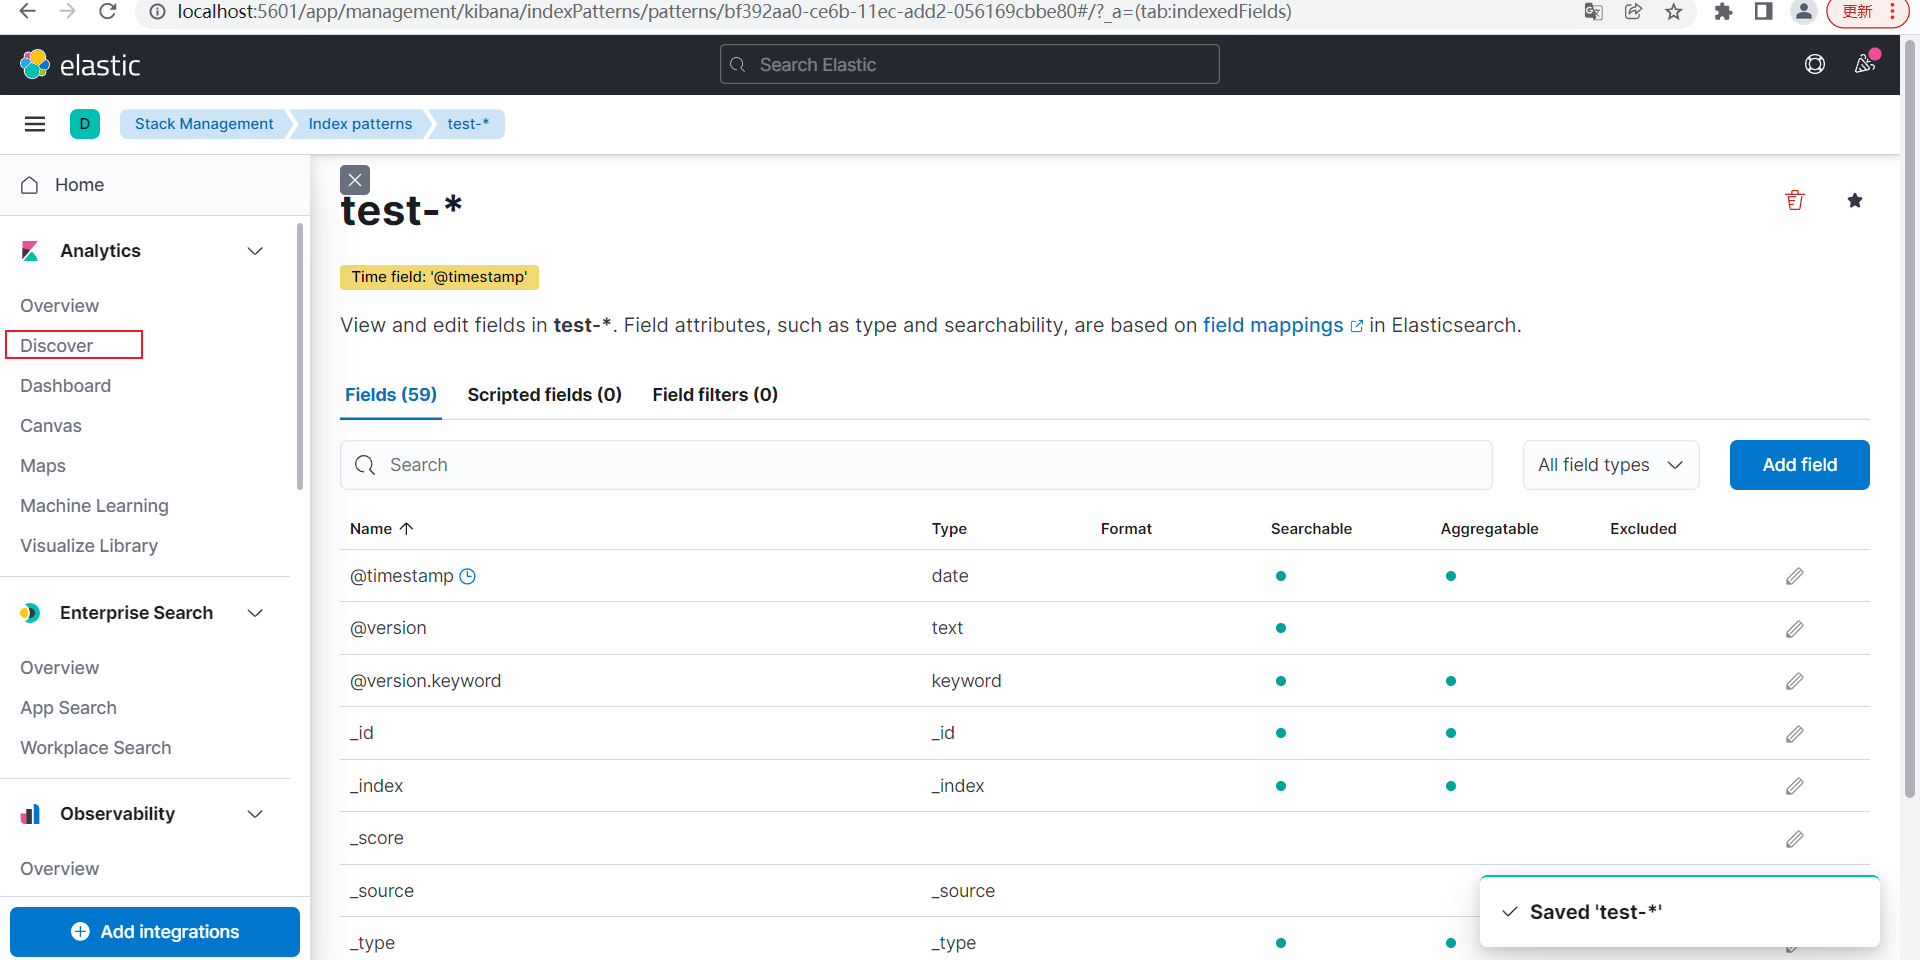
点击Create index pattern
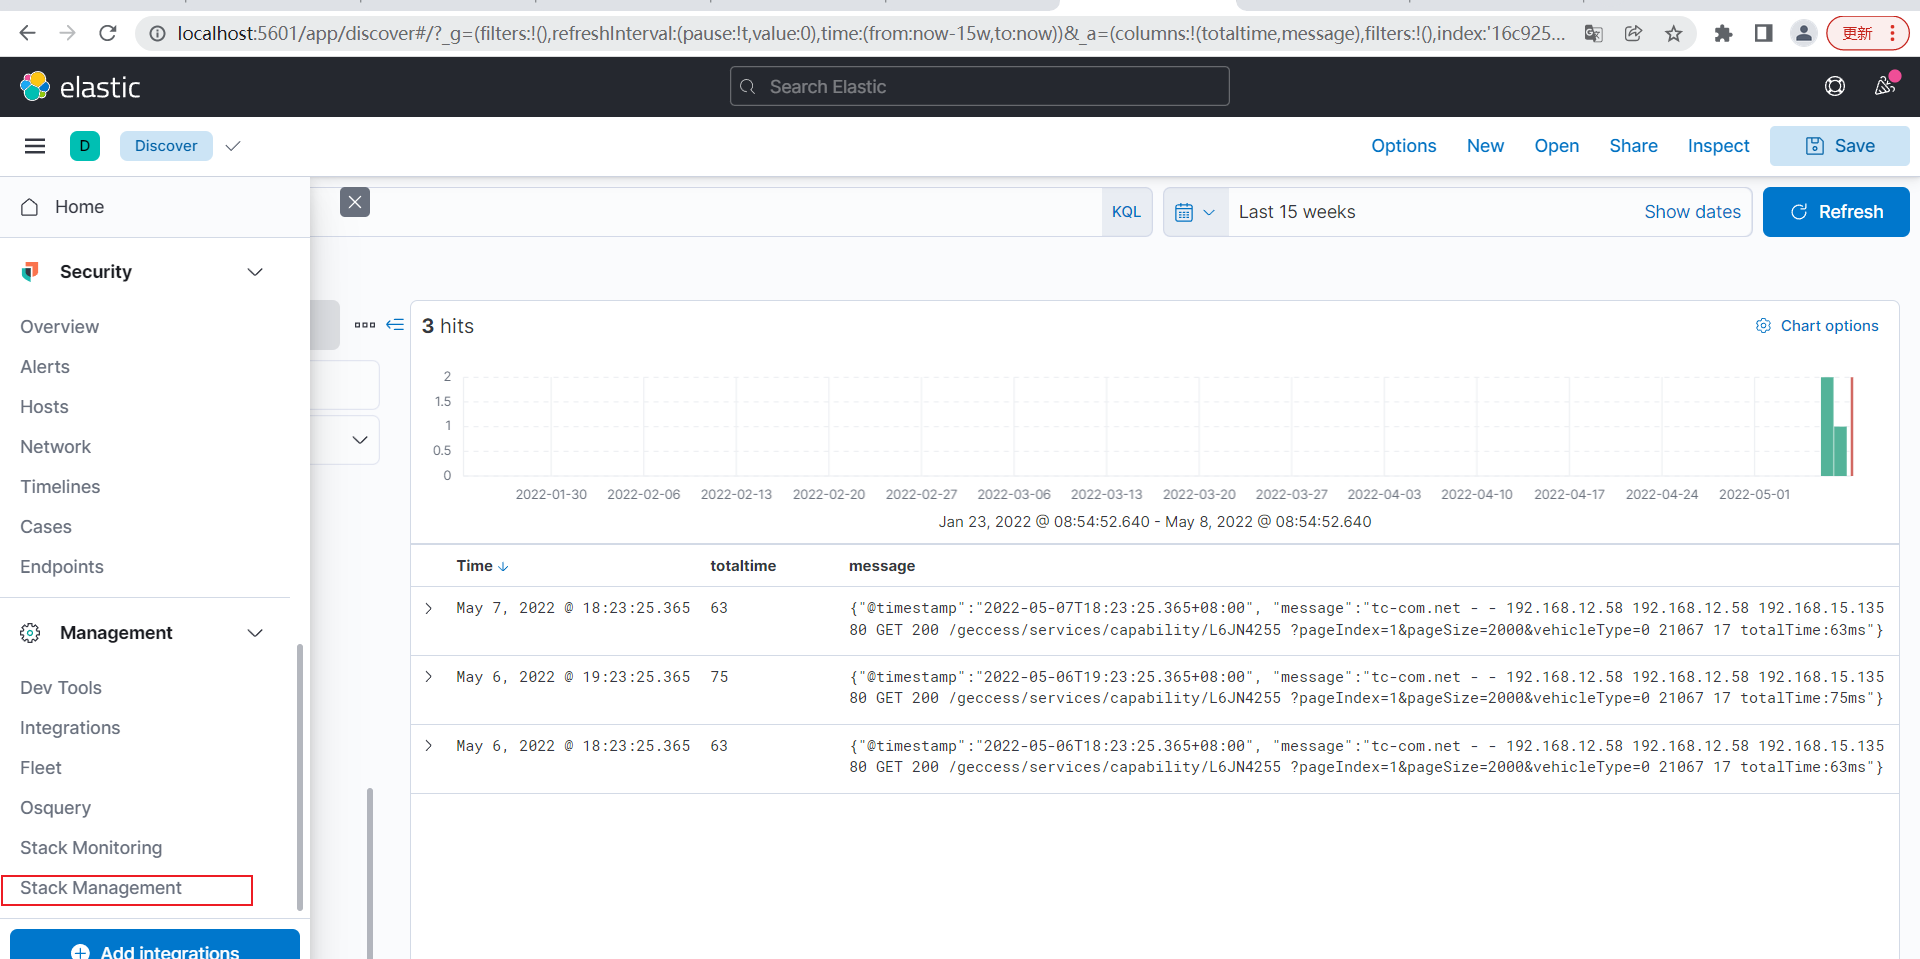
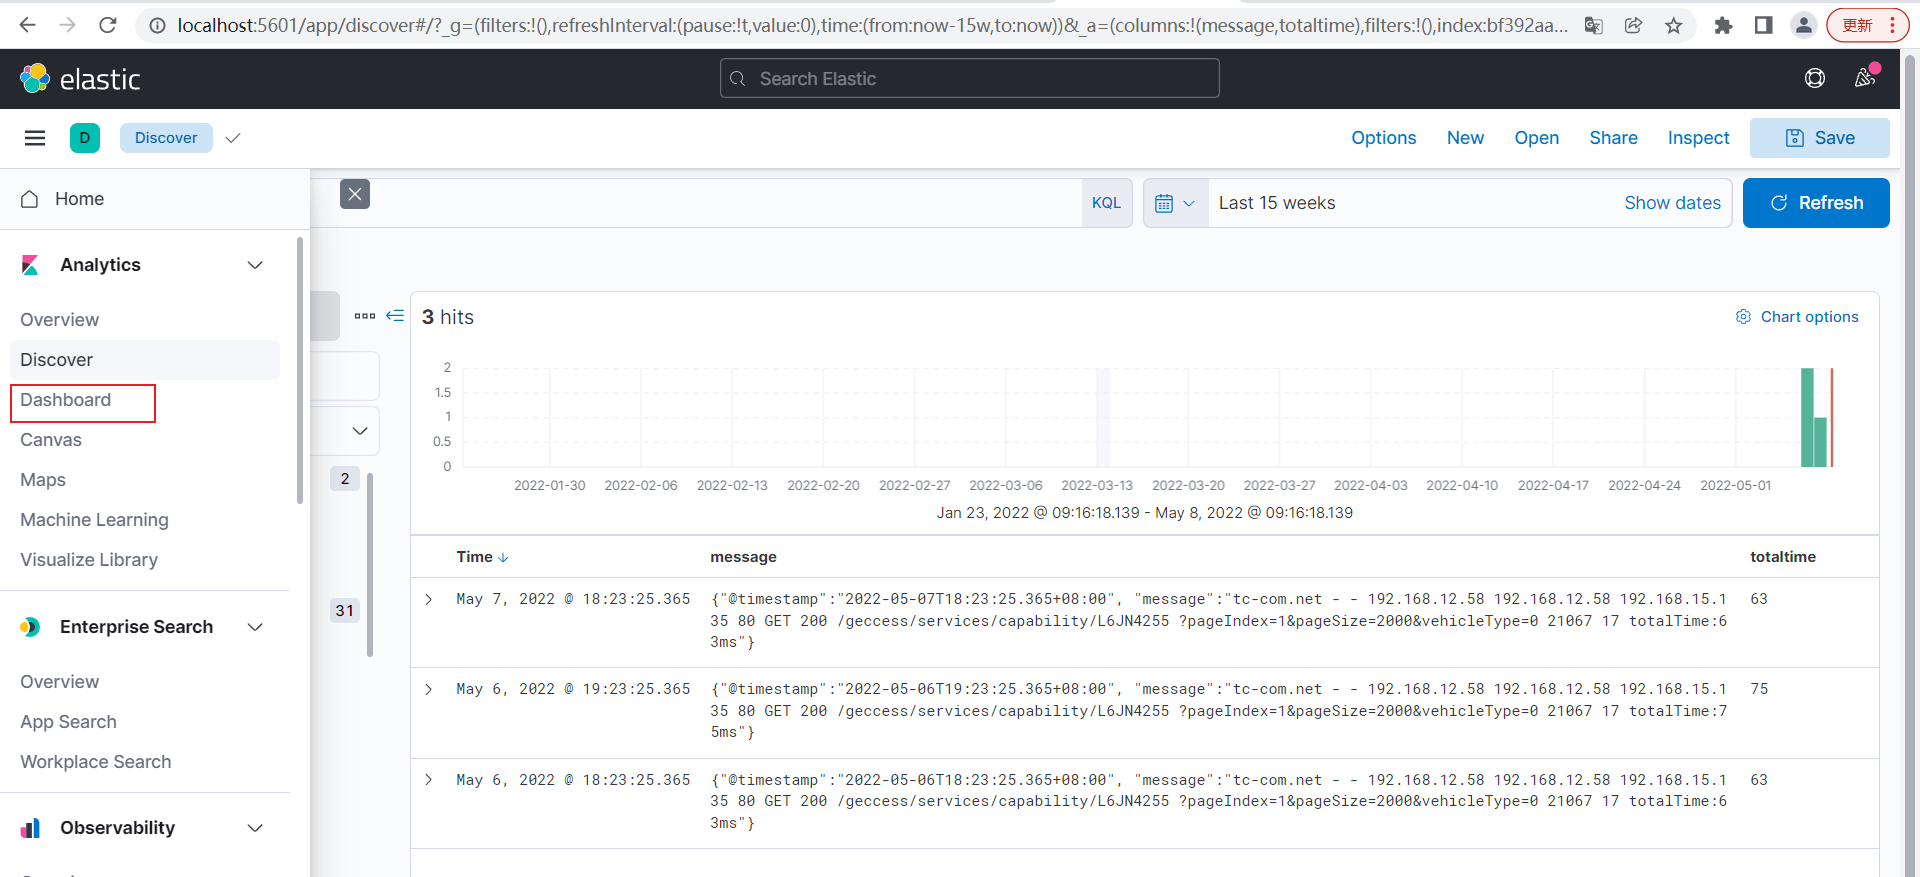
选择Discover
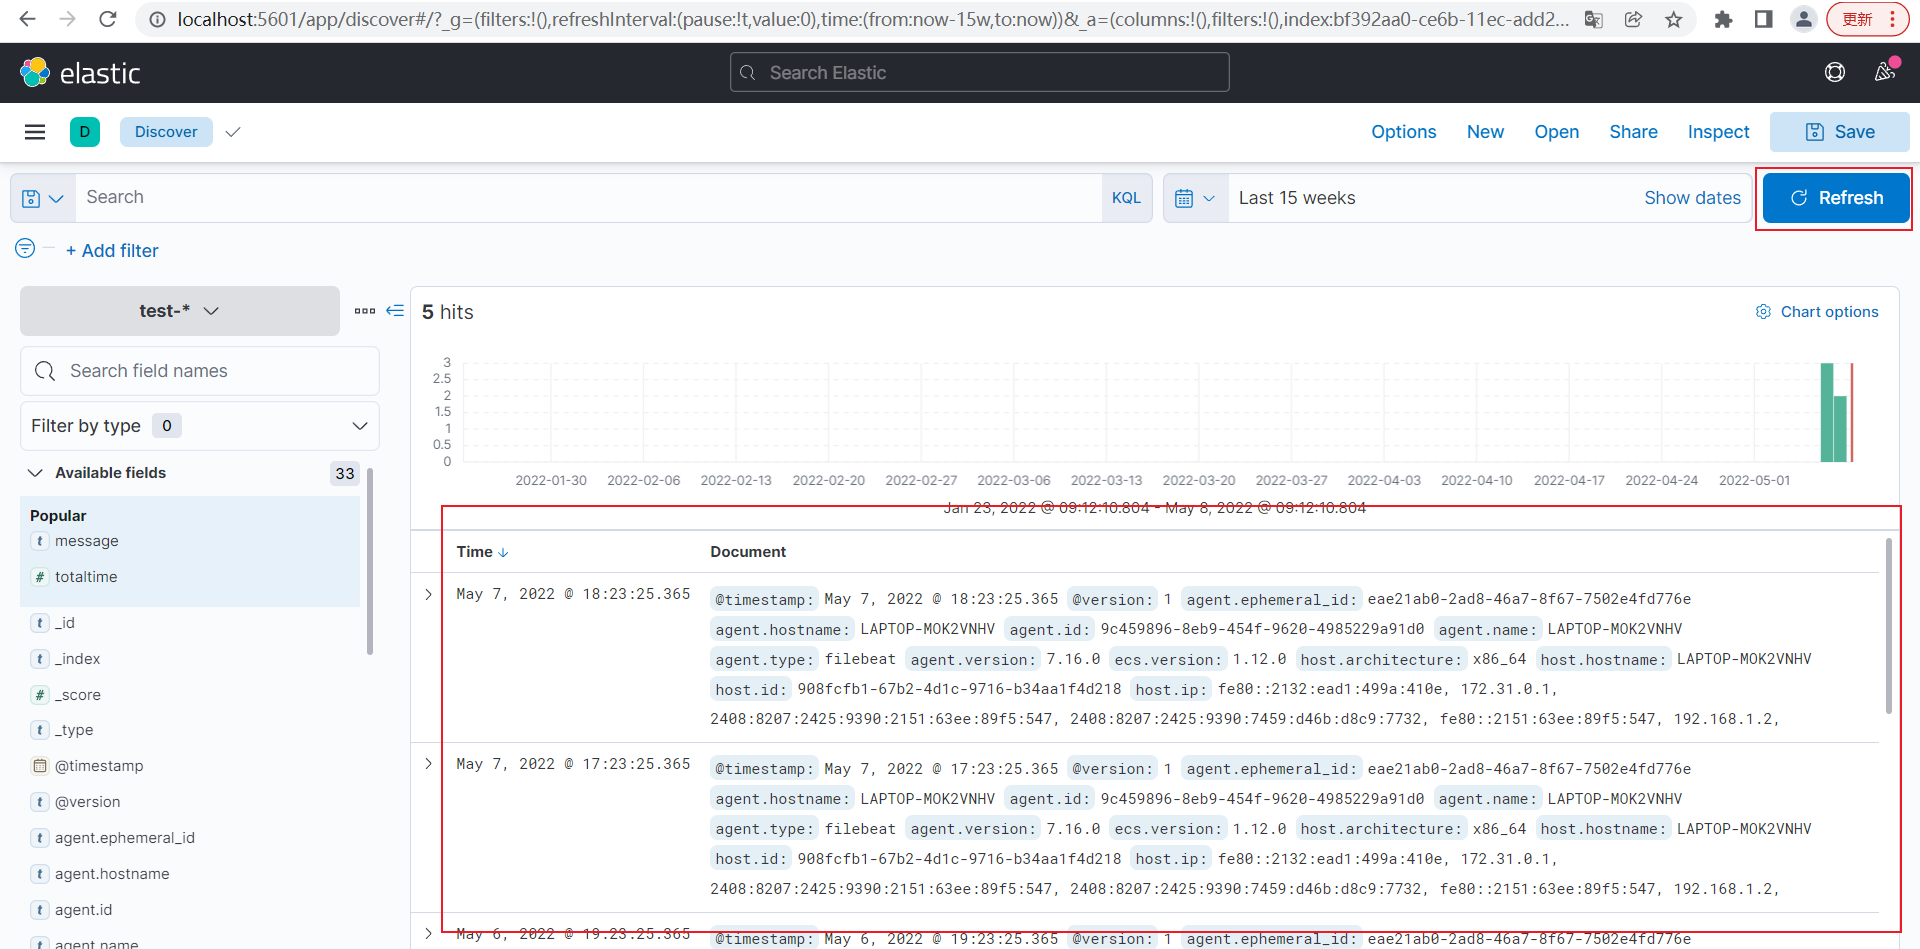
切换test-*索引,日期范围选大一点
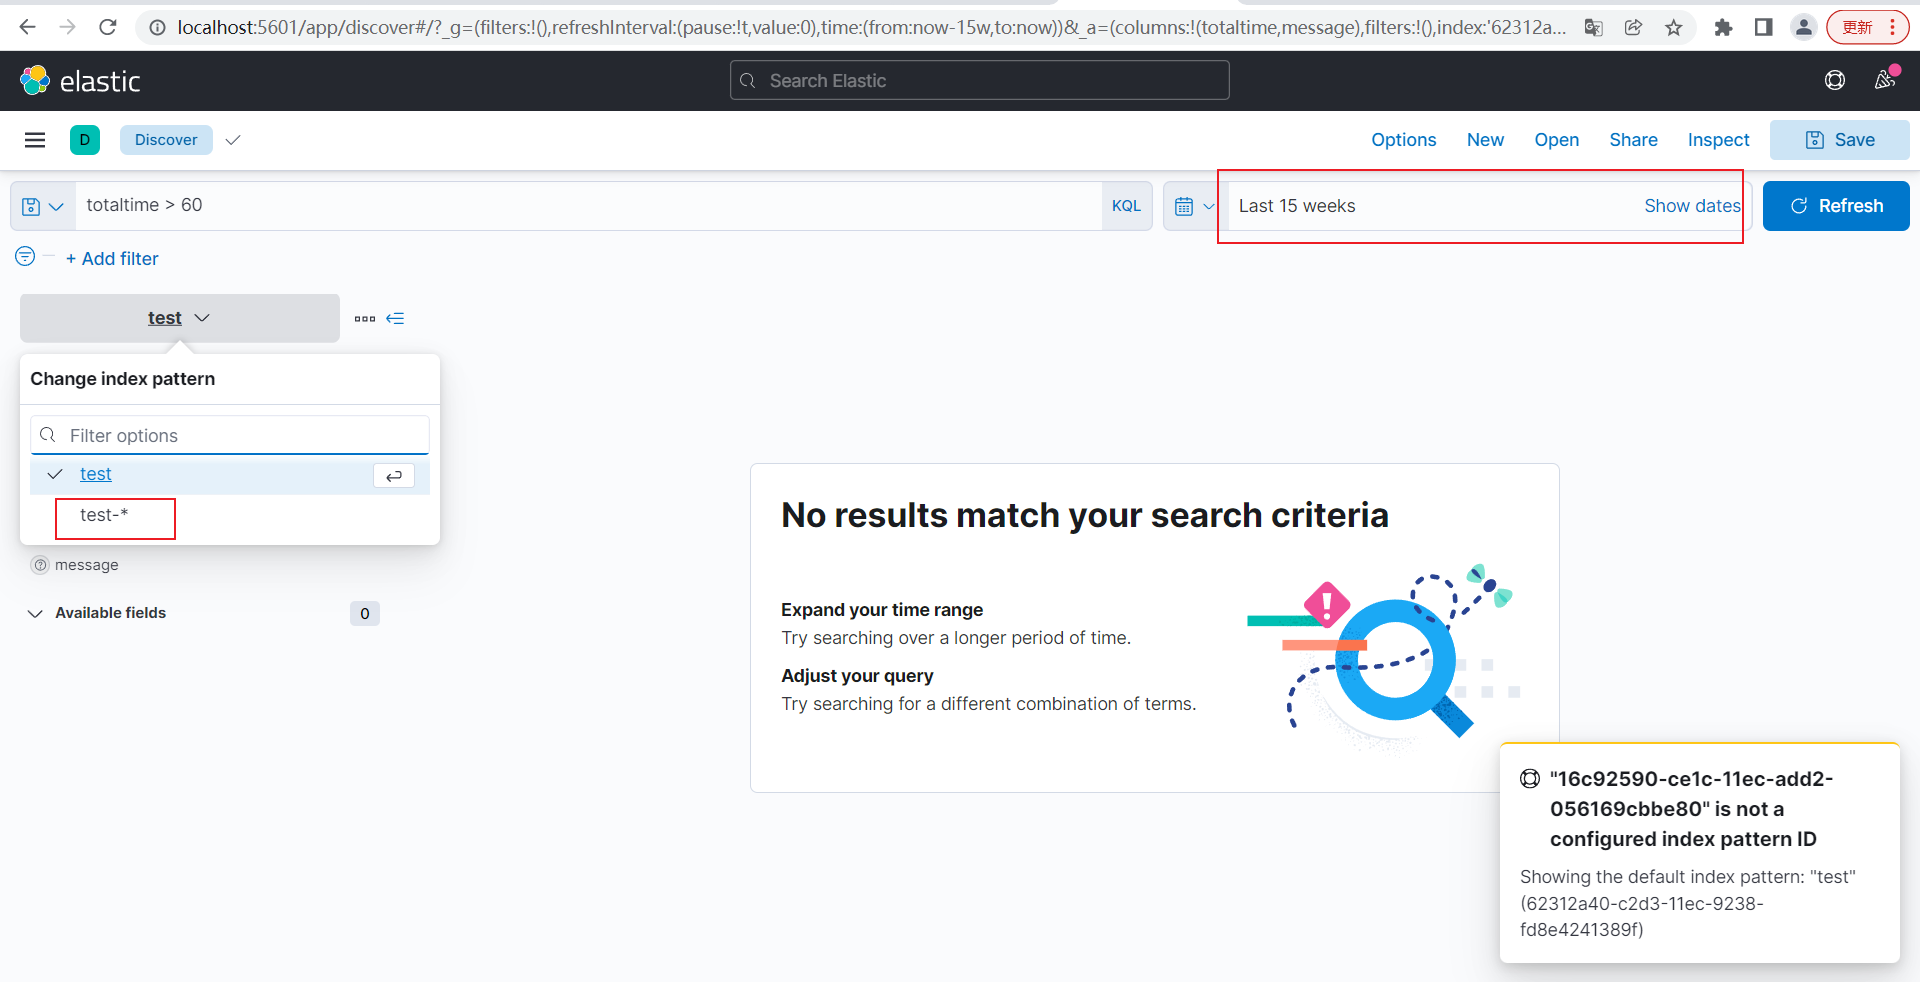
点击Refresh可以看到日志May 5和May 6的日志都加载过来了
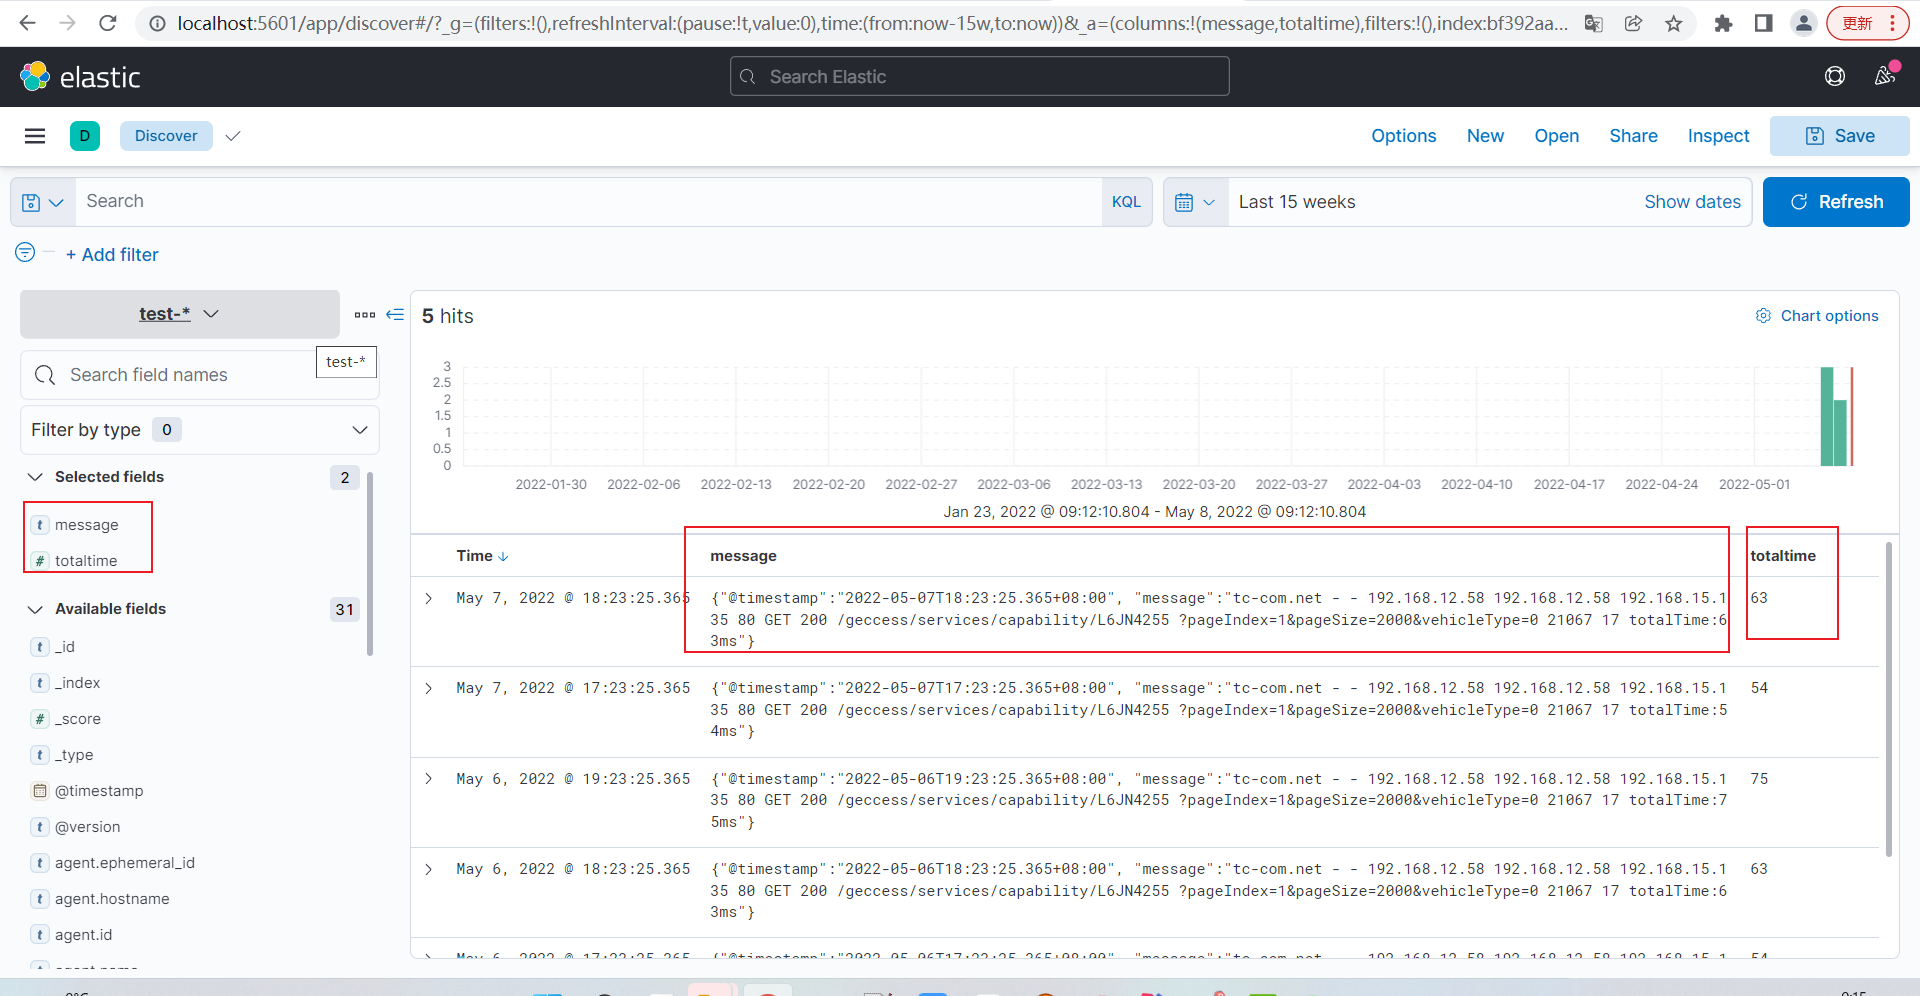
点击message和totaltime右边的加号
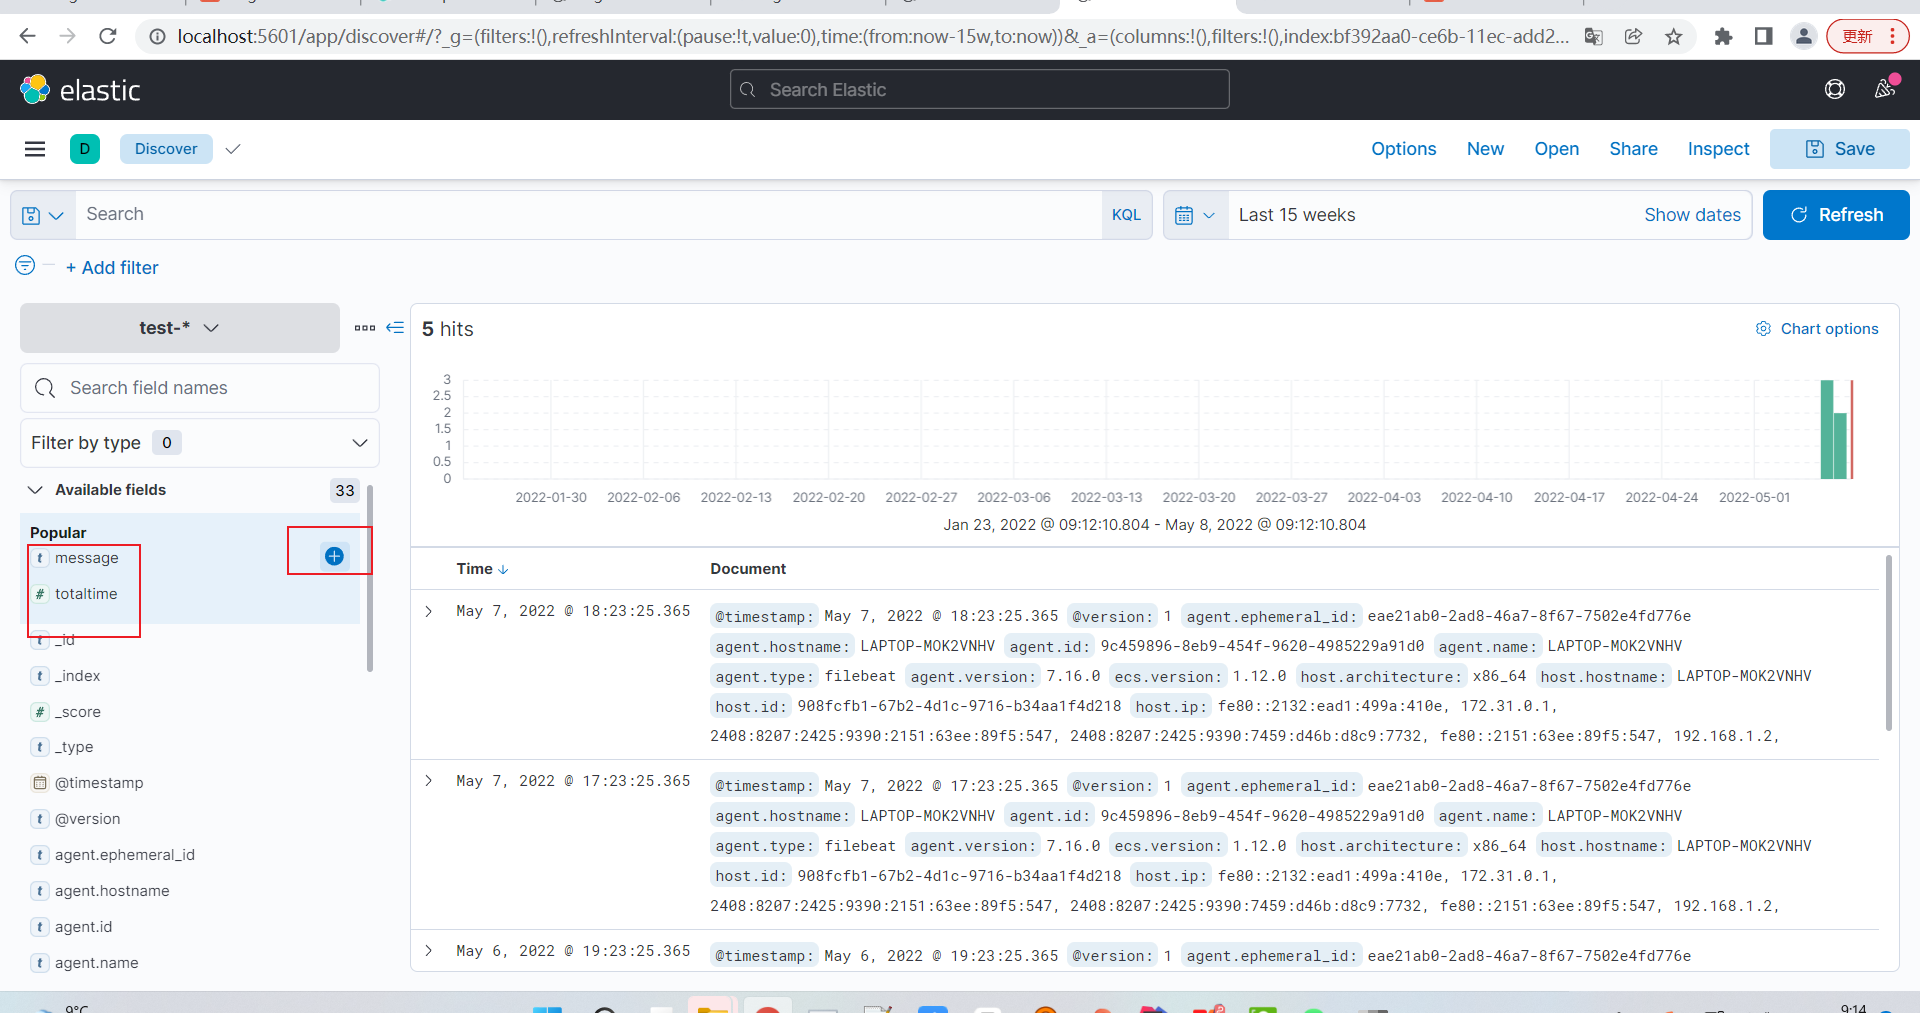
可以看下只展示了message和totaltime的数据
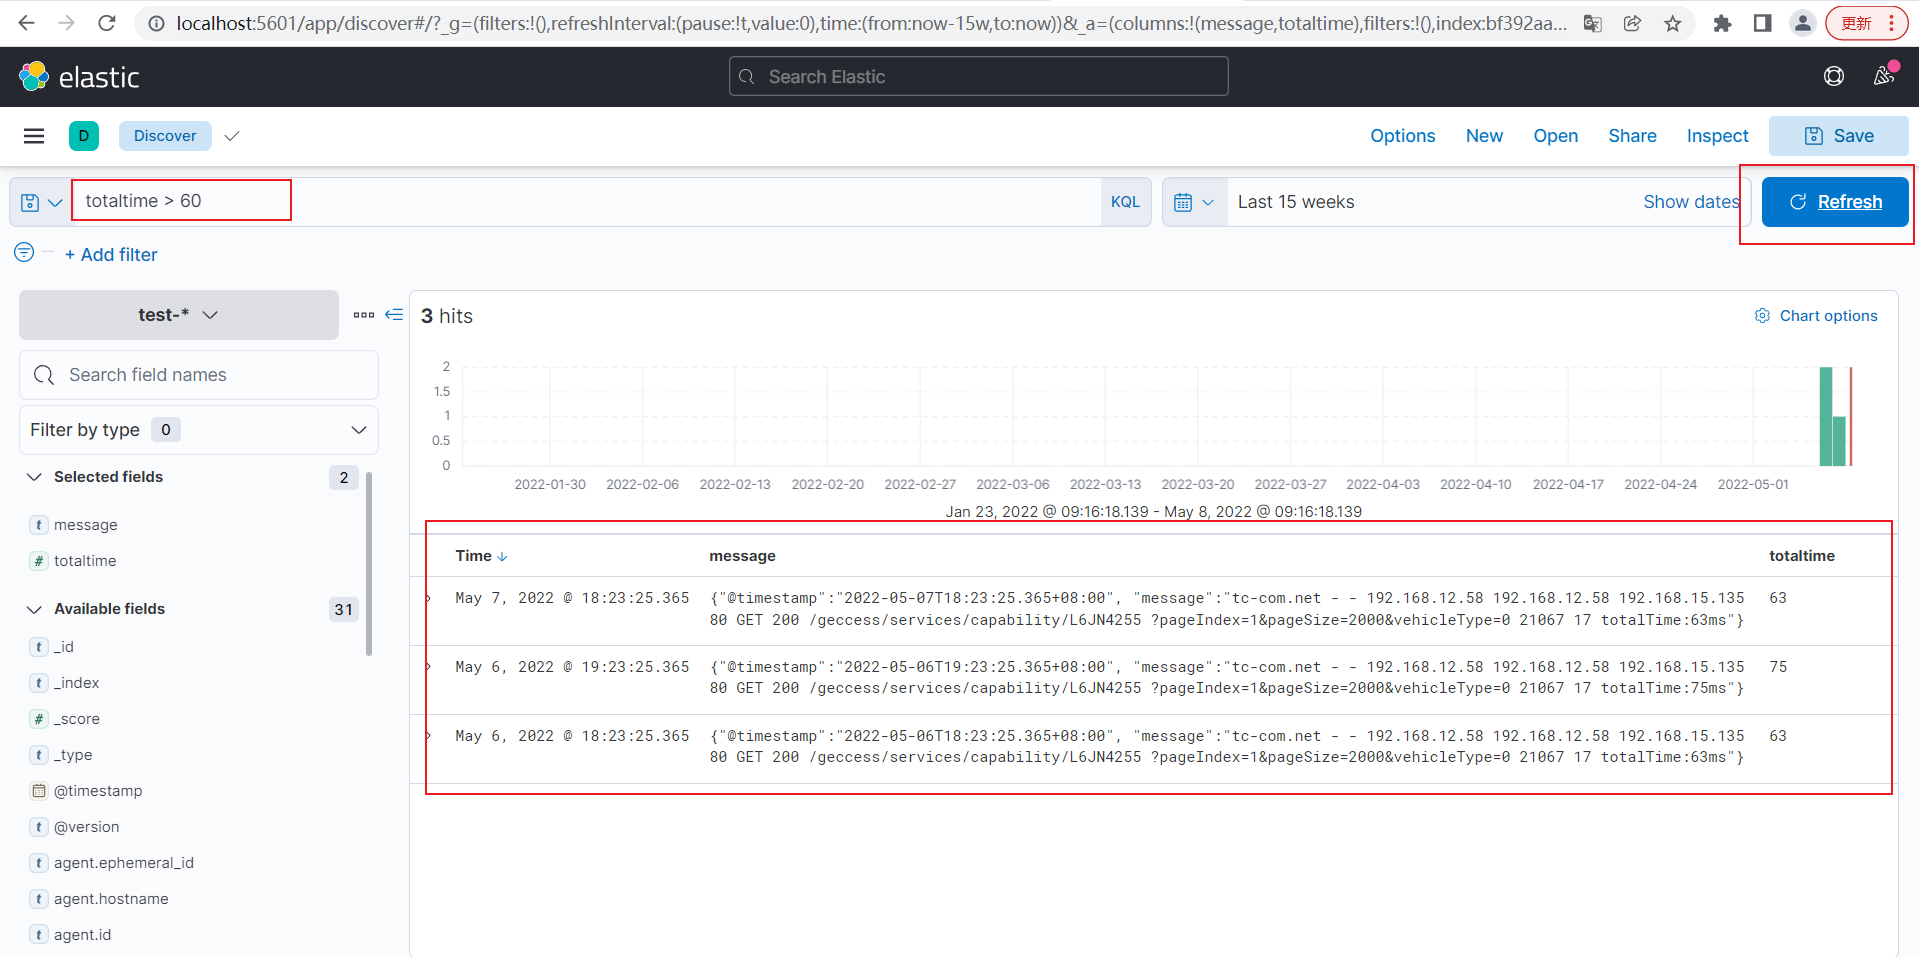
输入 totaltime>60可以看到totaltime大于60的数据
kibana Dashboard统计totaltime
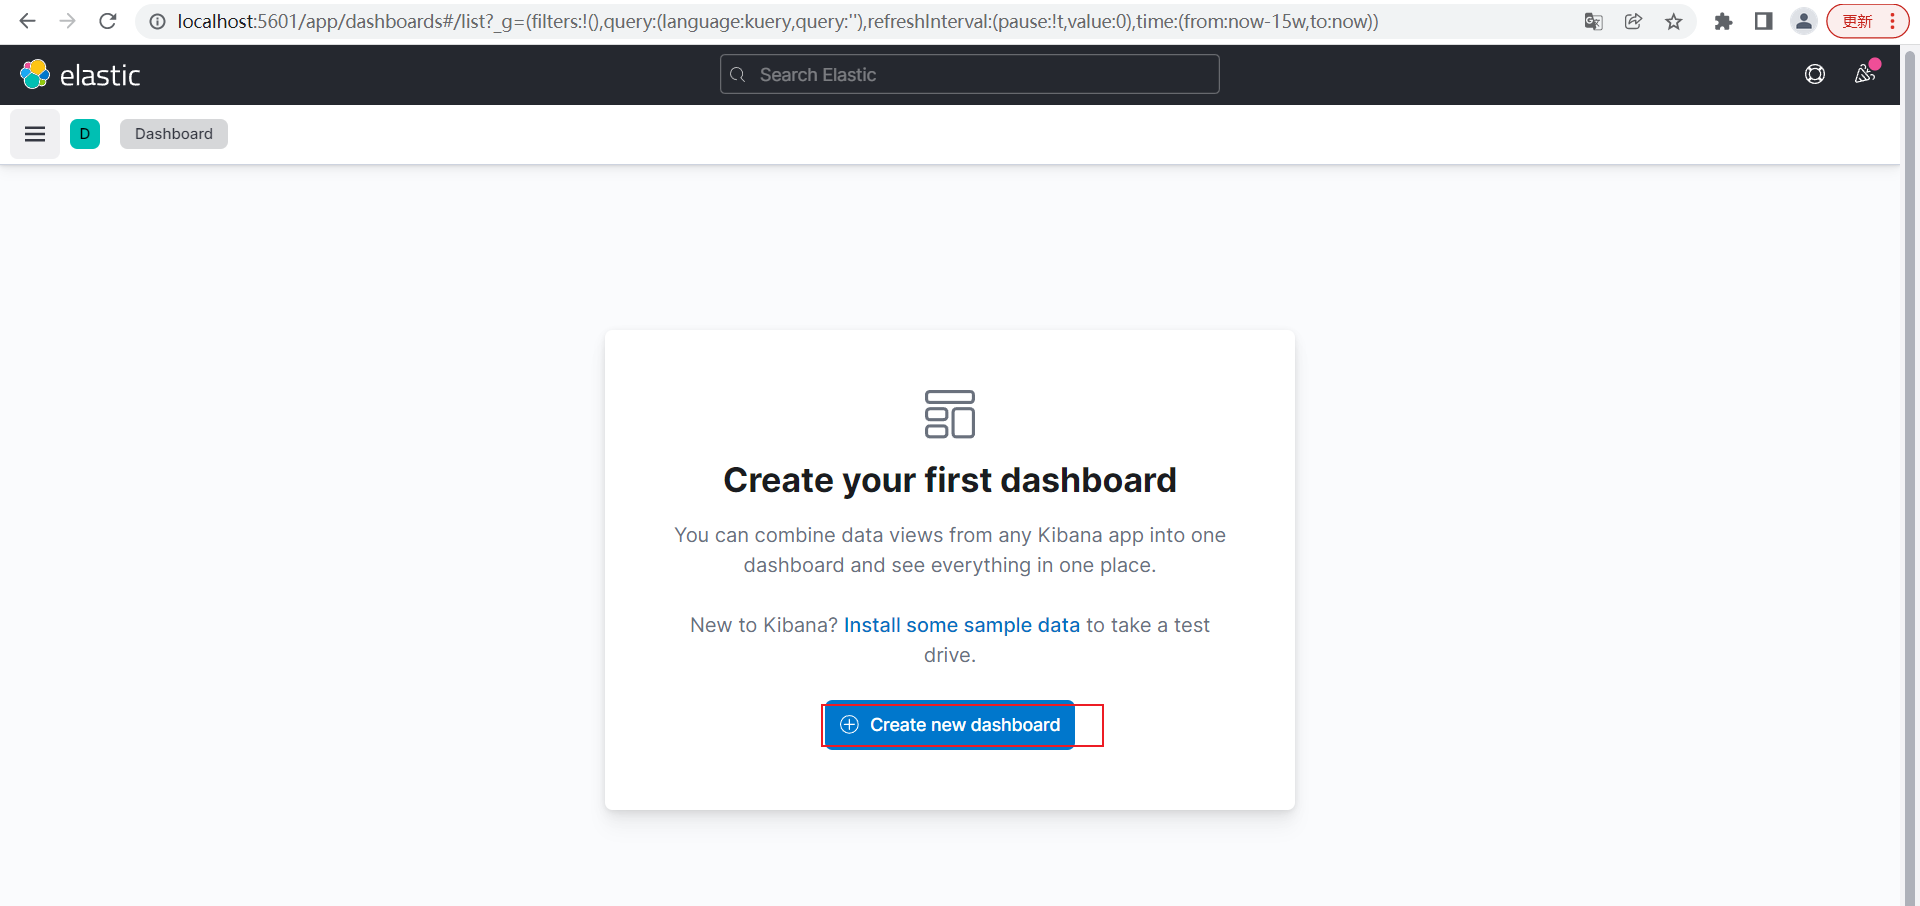
点击Dashboard
点击Create new dashboard
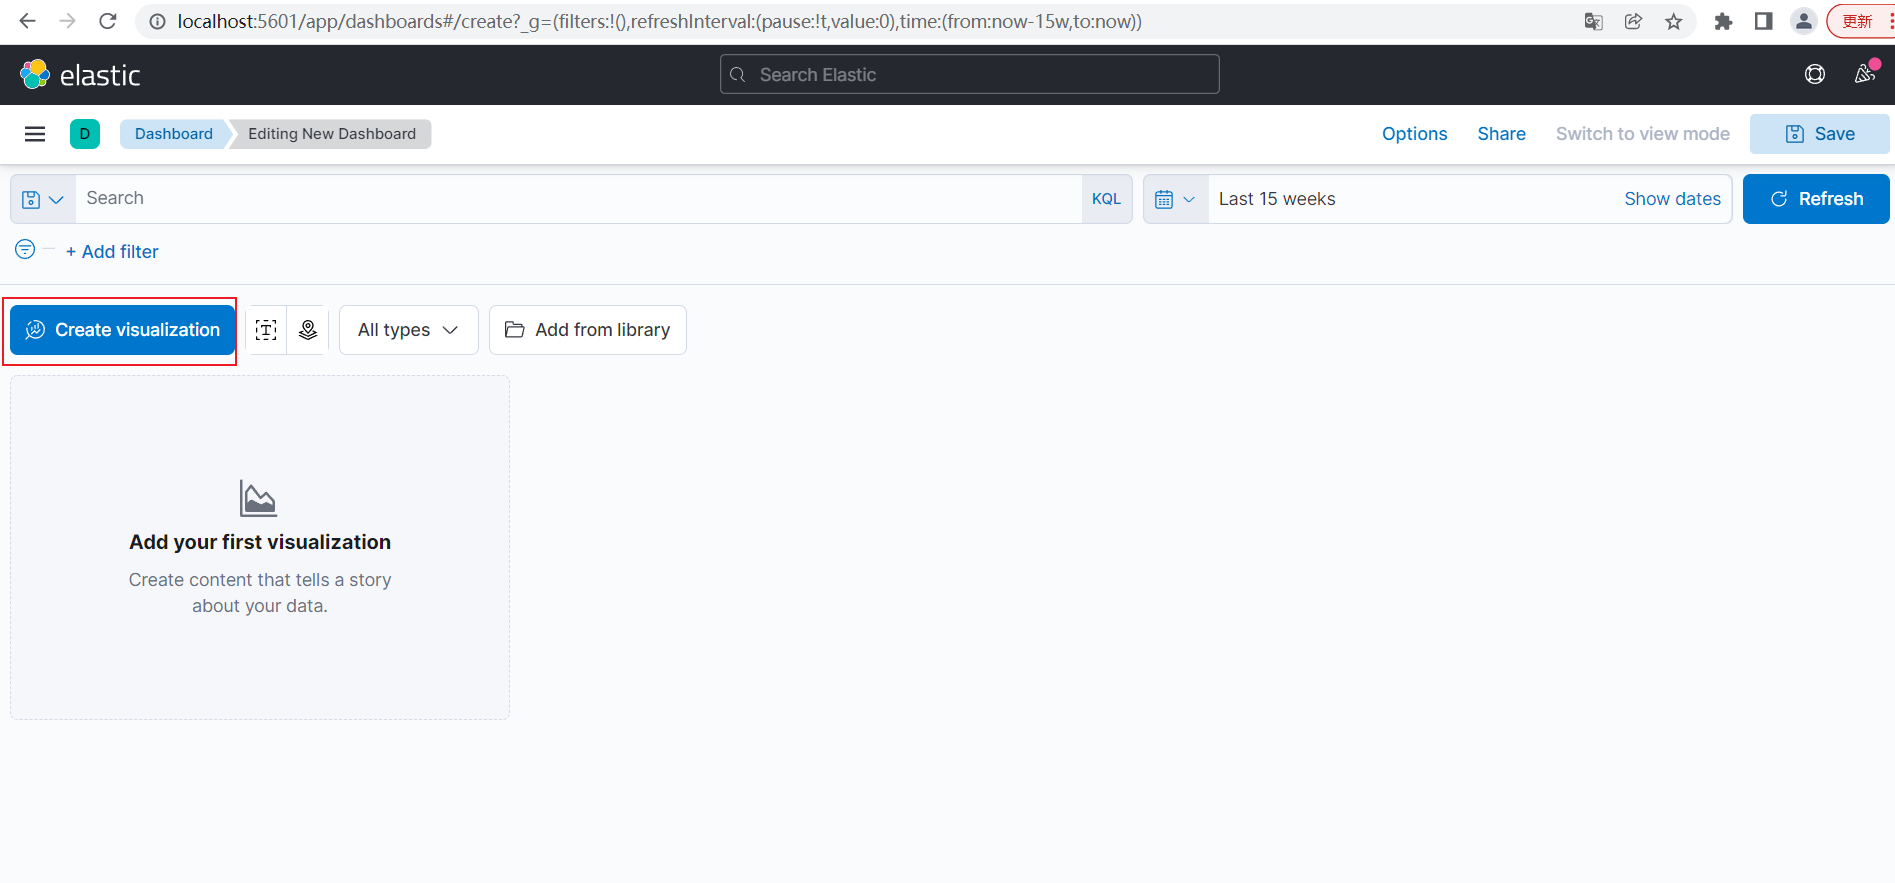
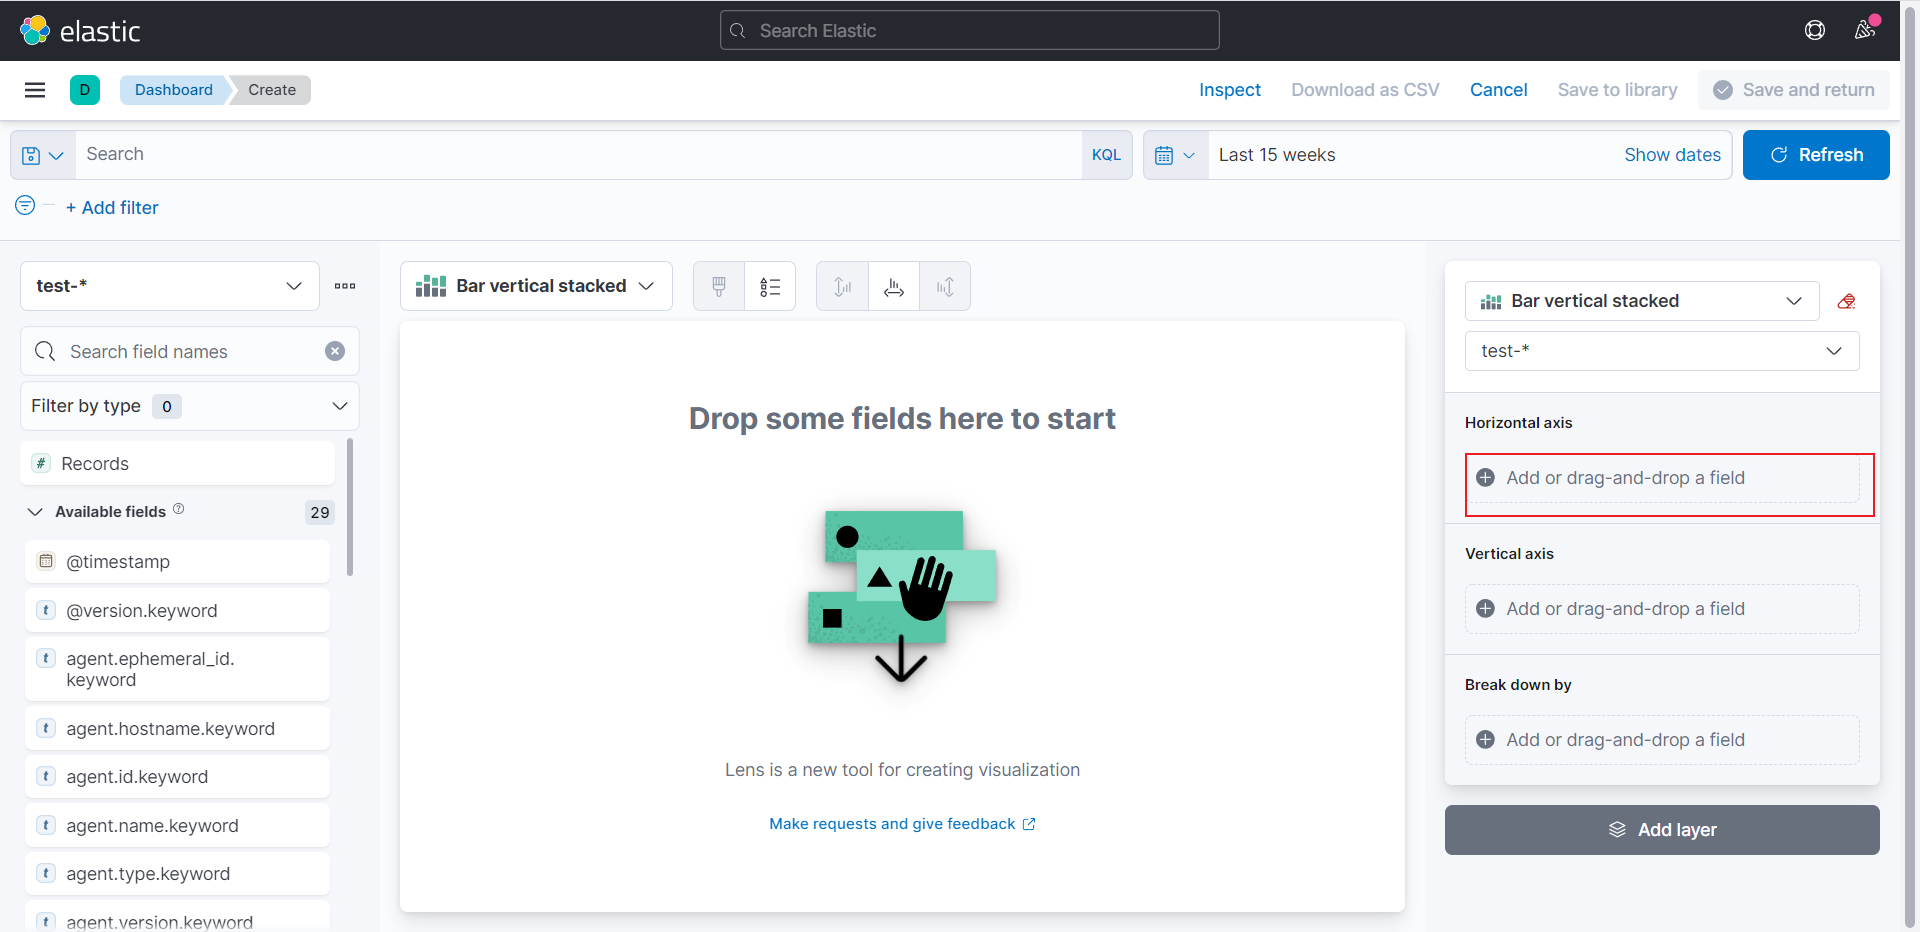
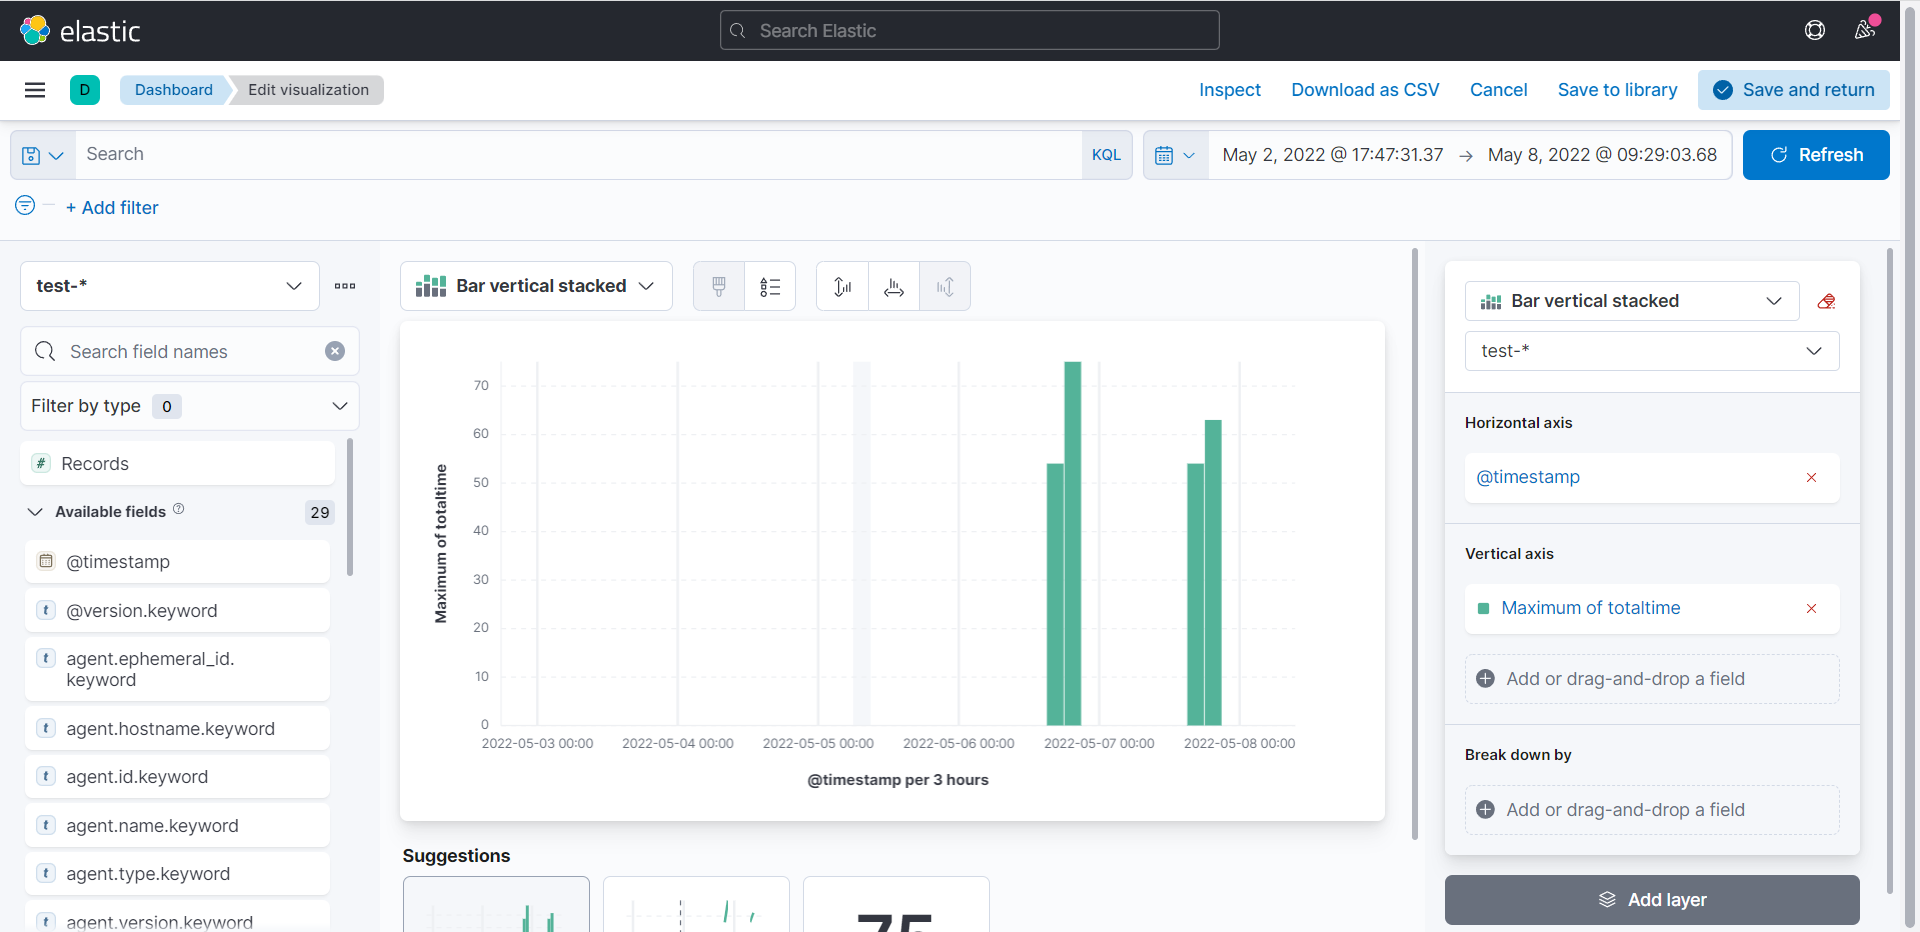
点击Create visualization
切换到test-*索引
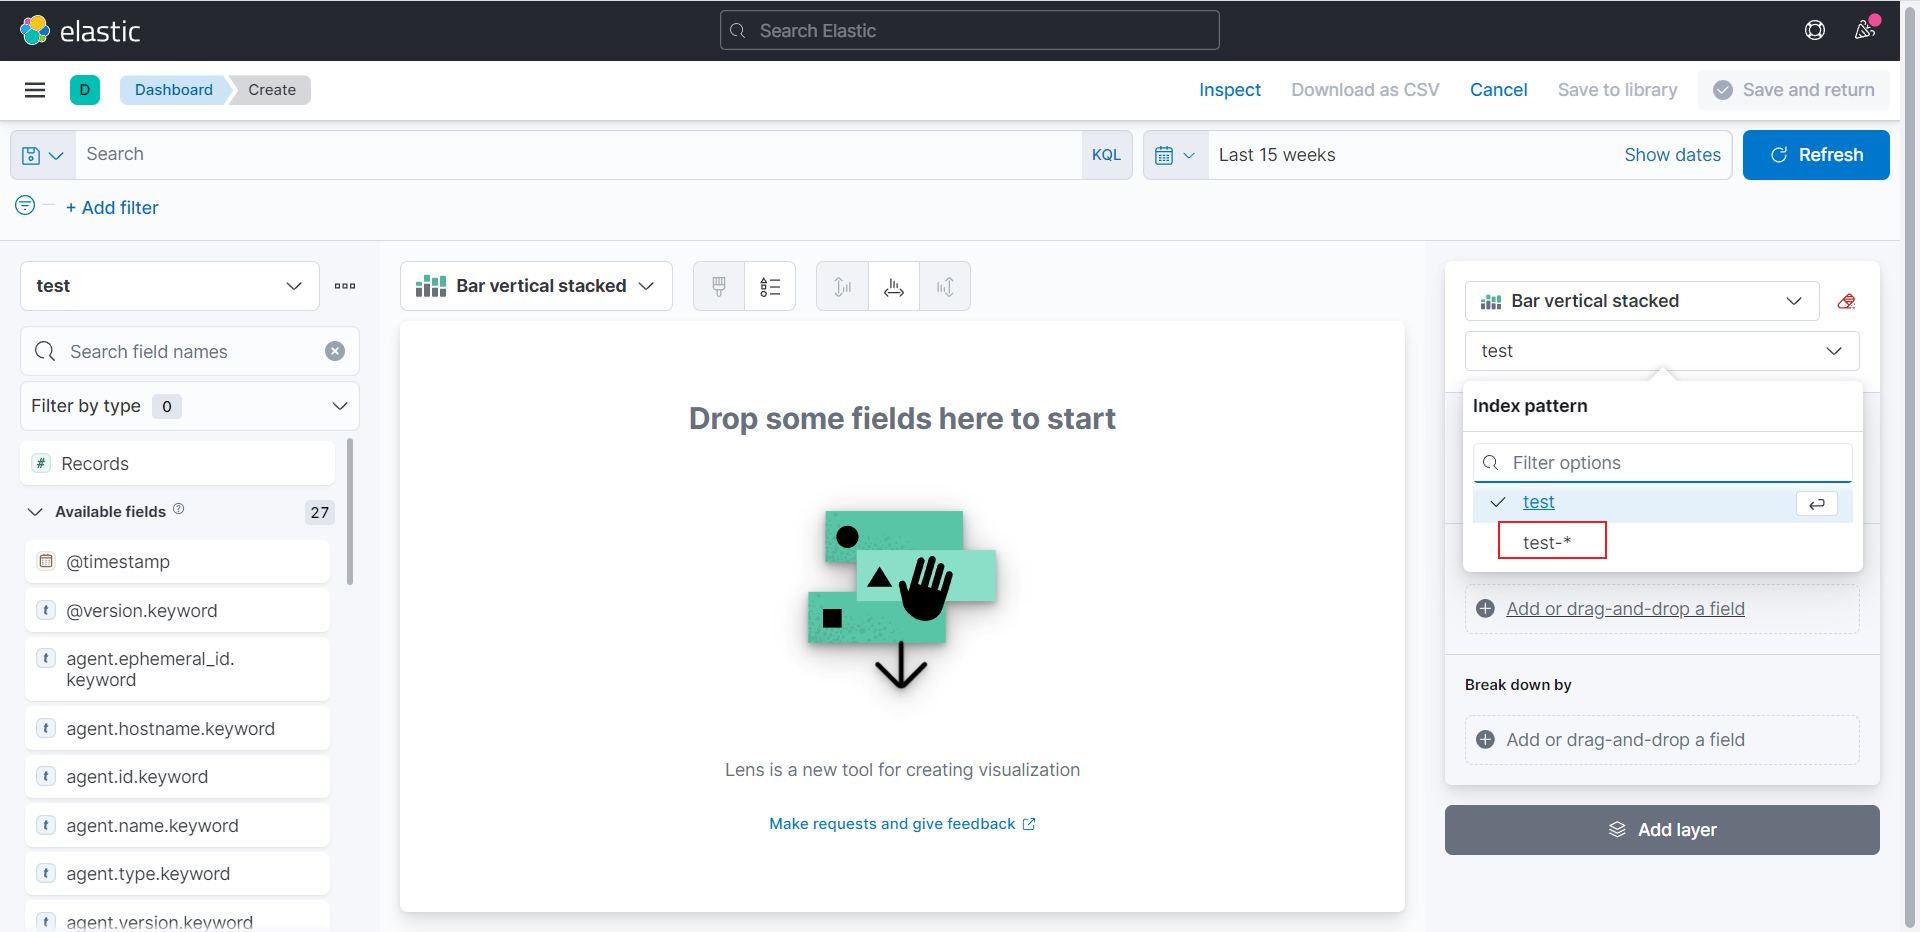
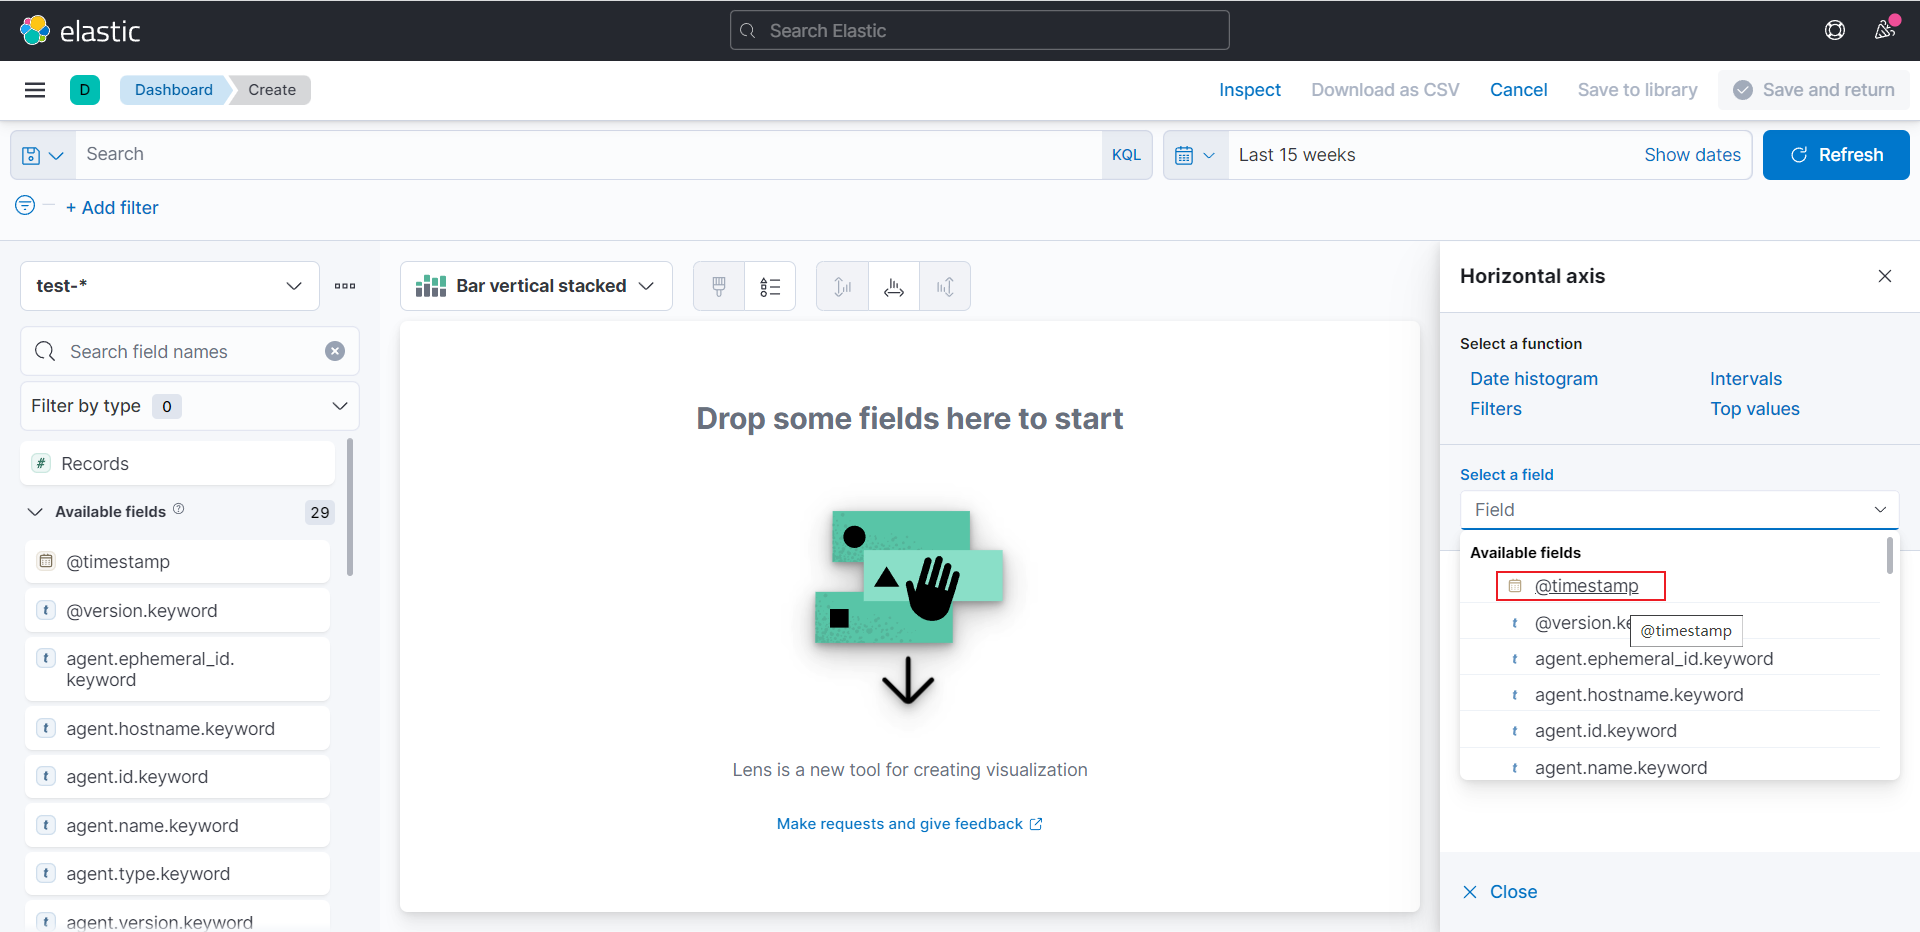
点击选择横坐标
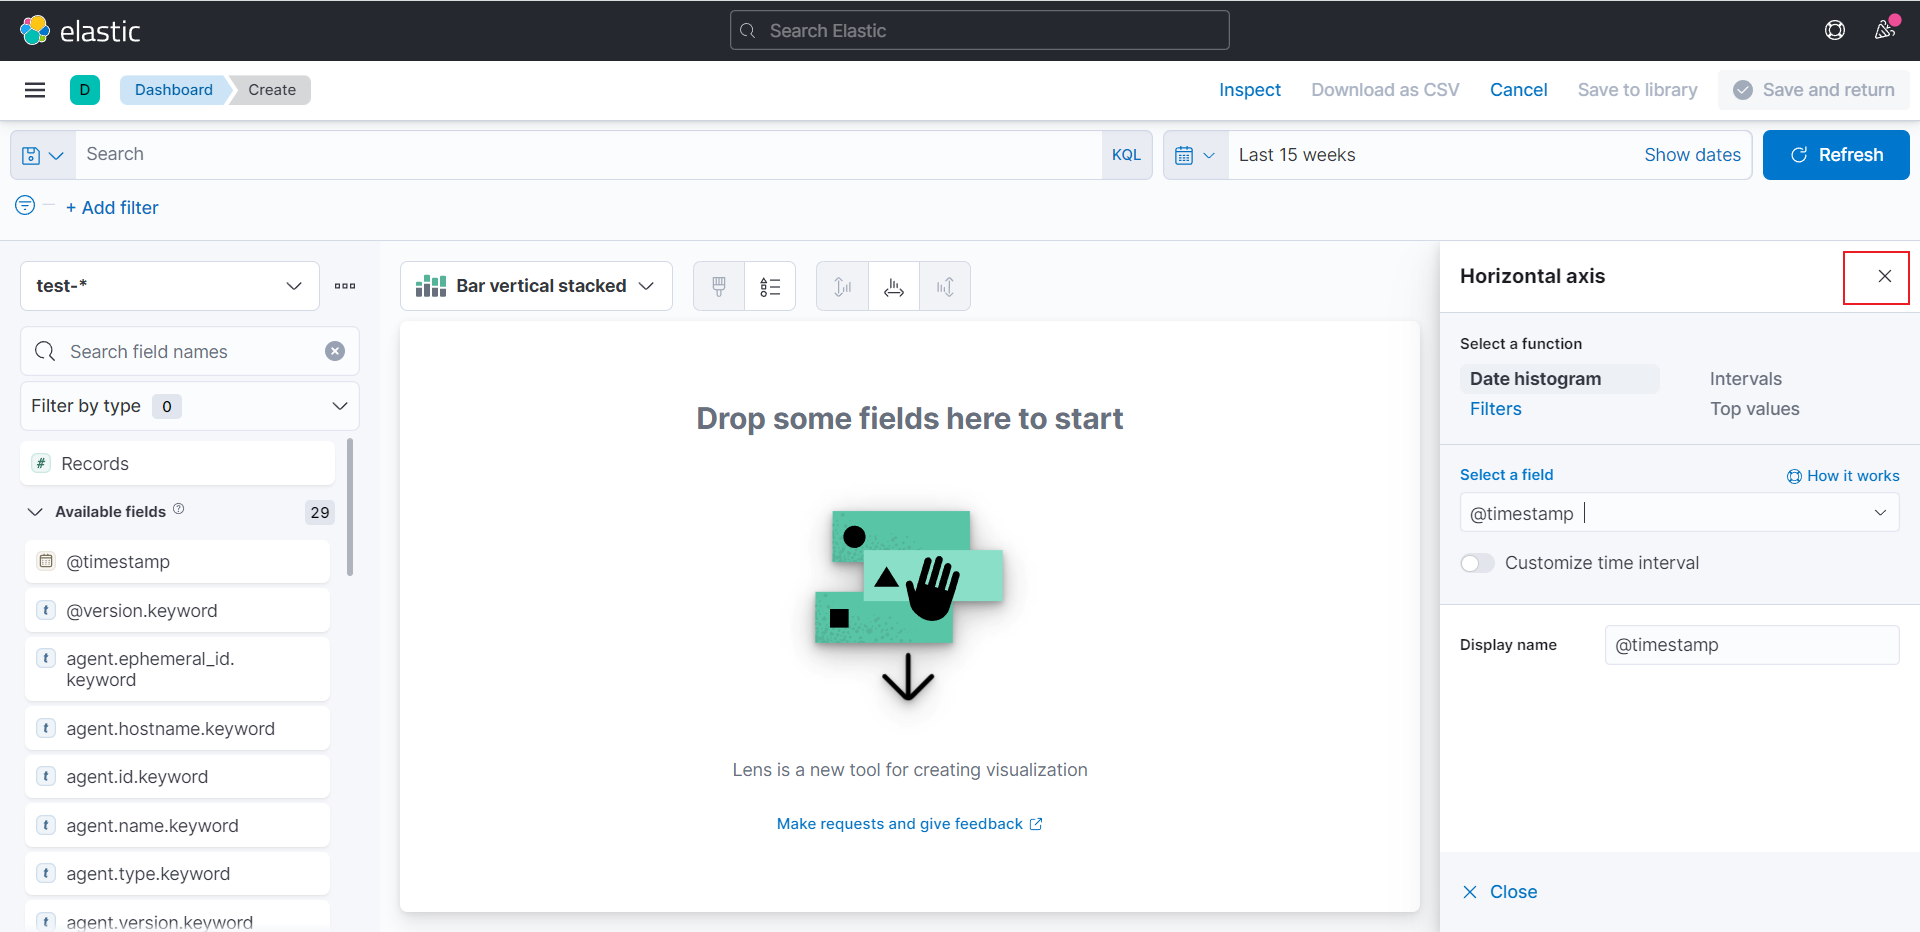
选择@timestamp为横坐标
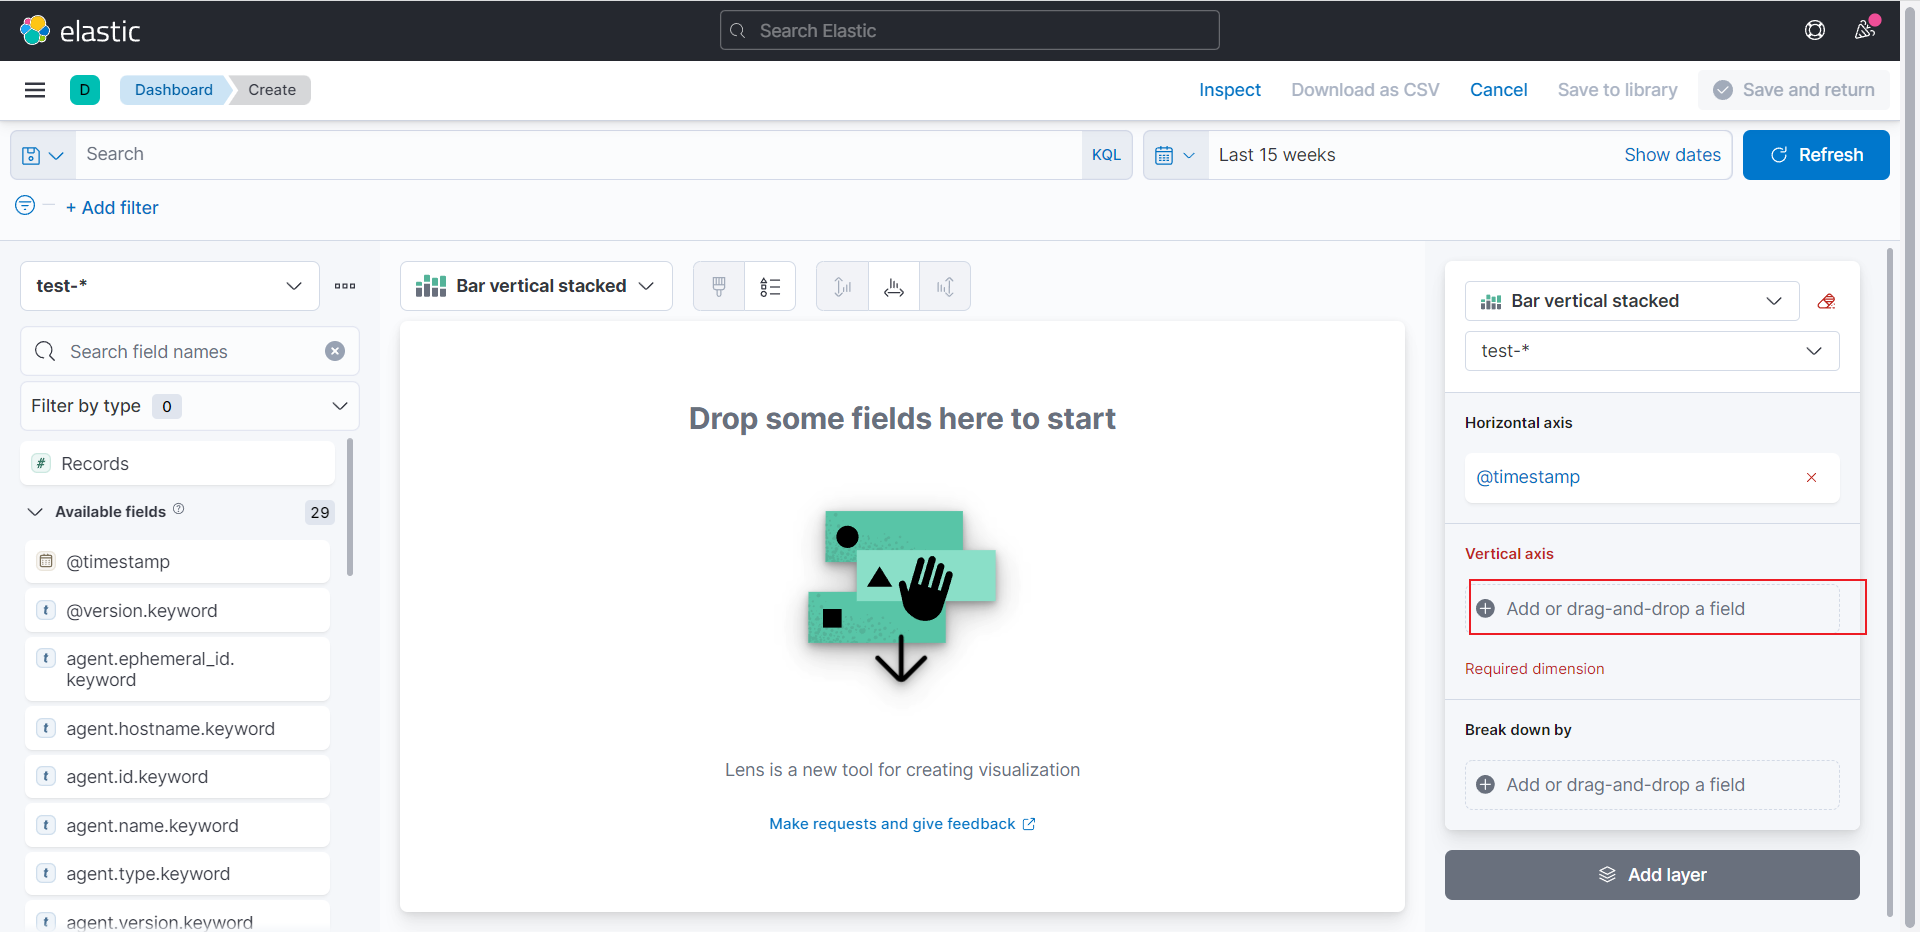
选择好后关闭
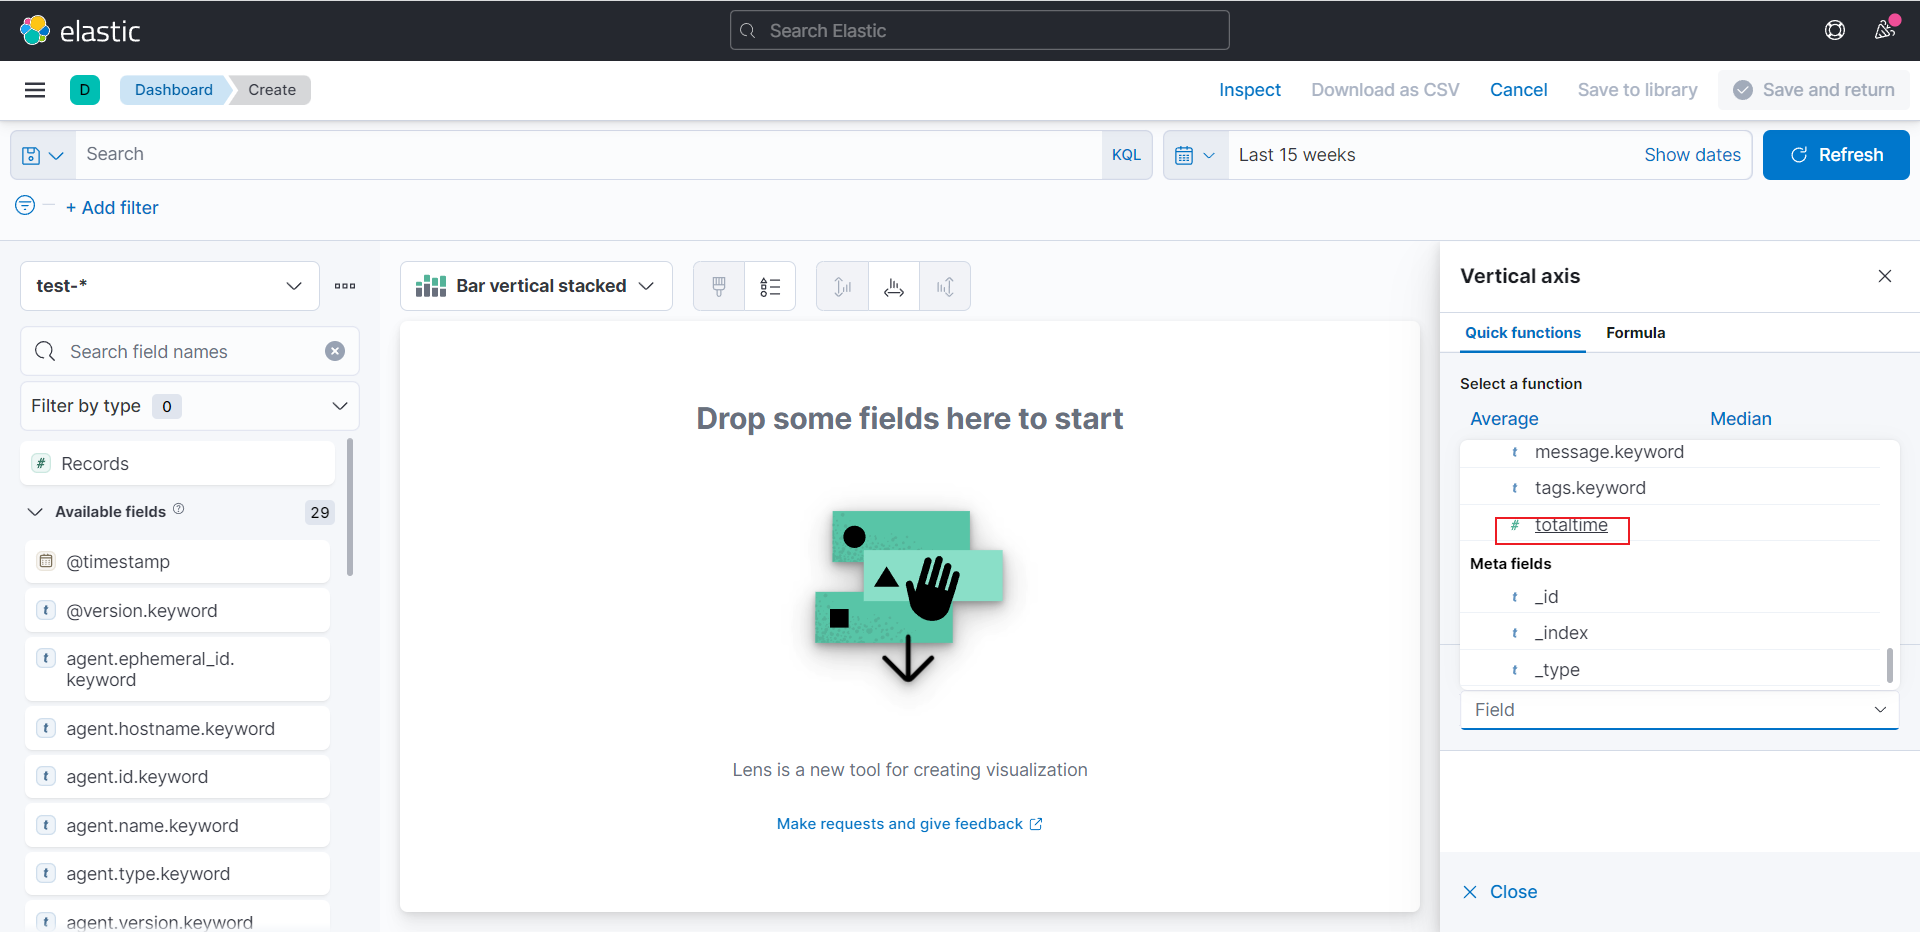
选择纵坐标
选择totaltime
选择Maximun最大值
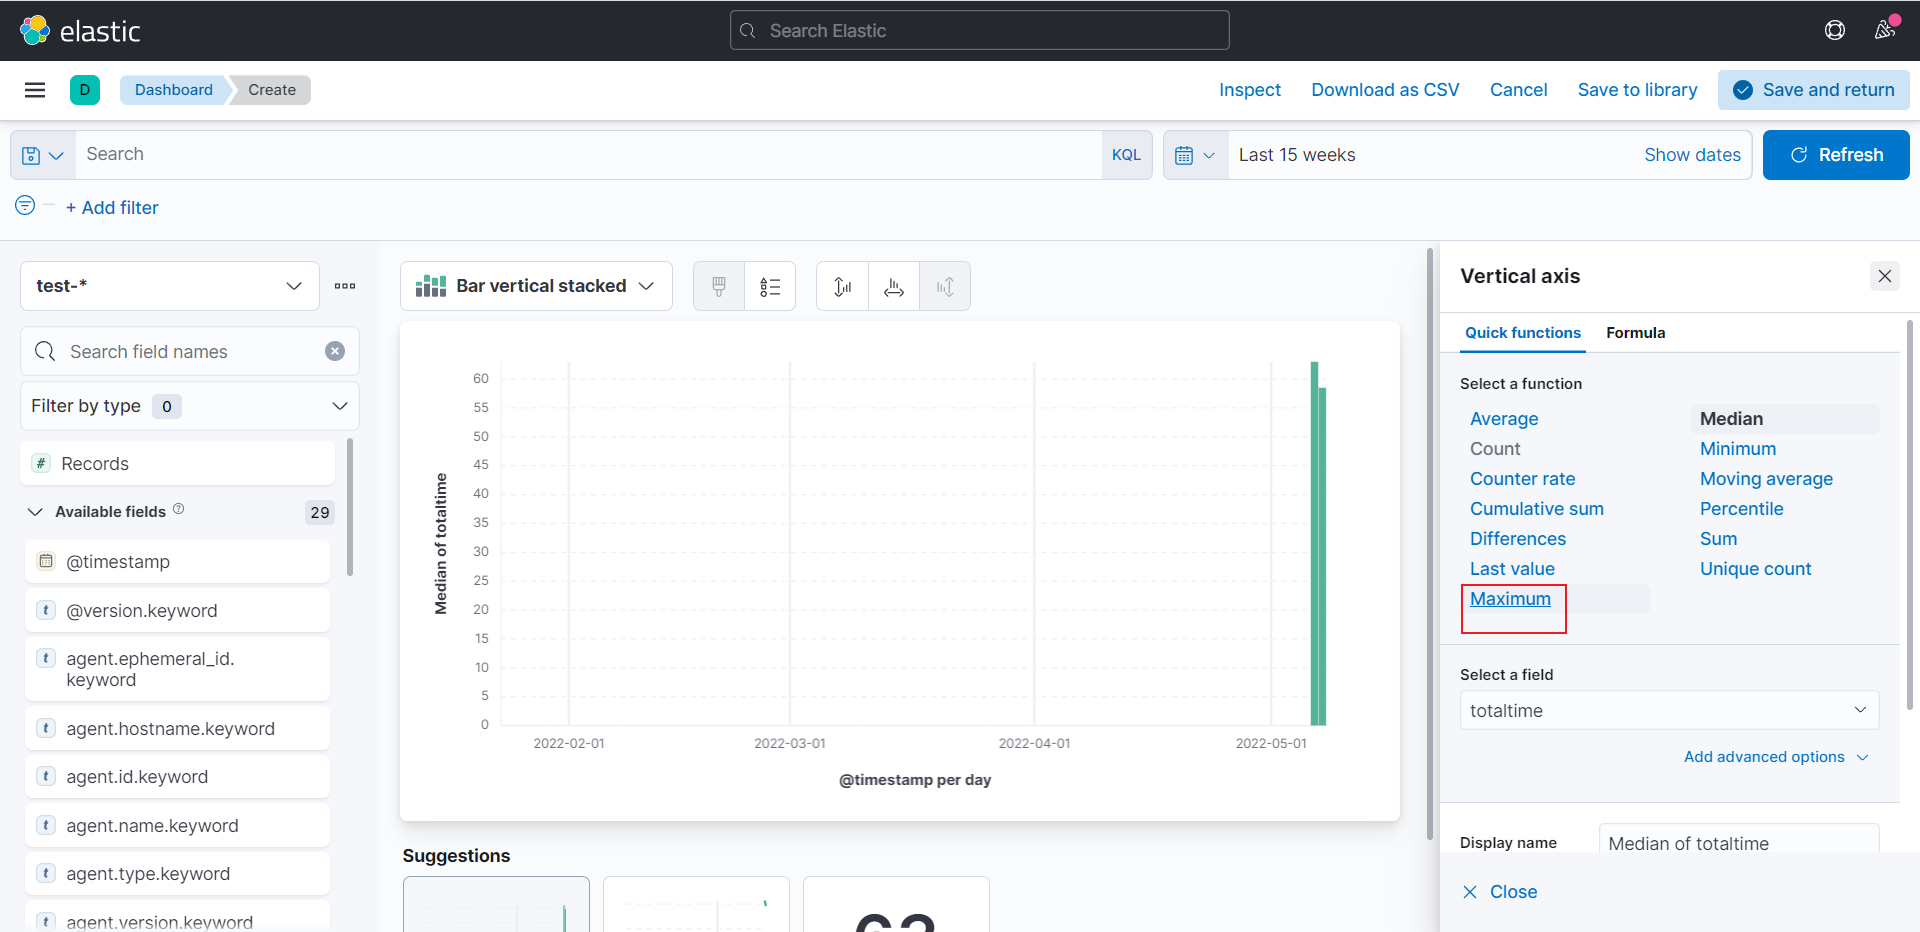
关闭
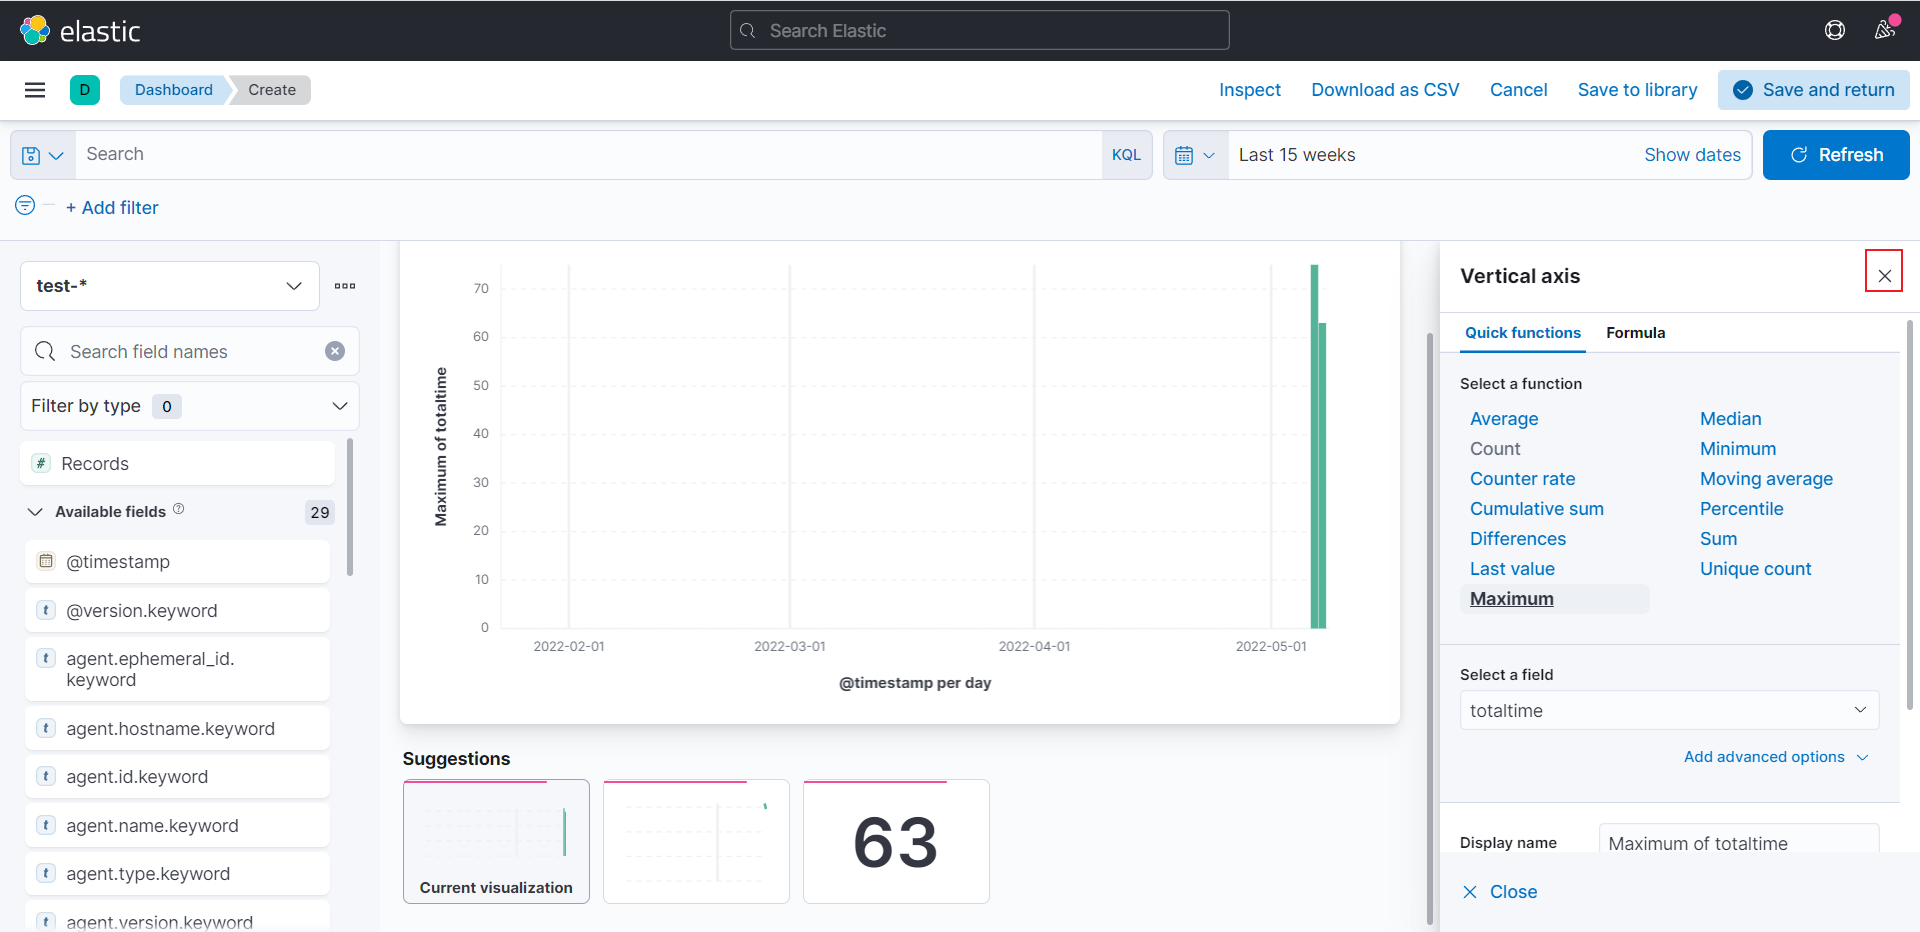
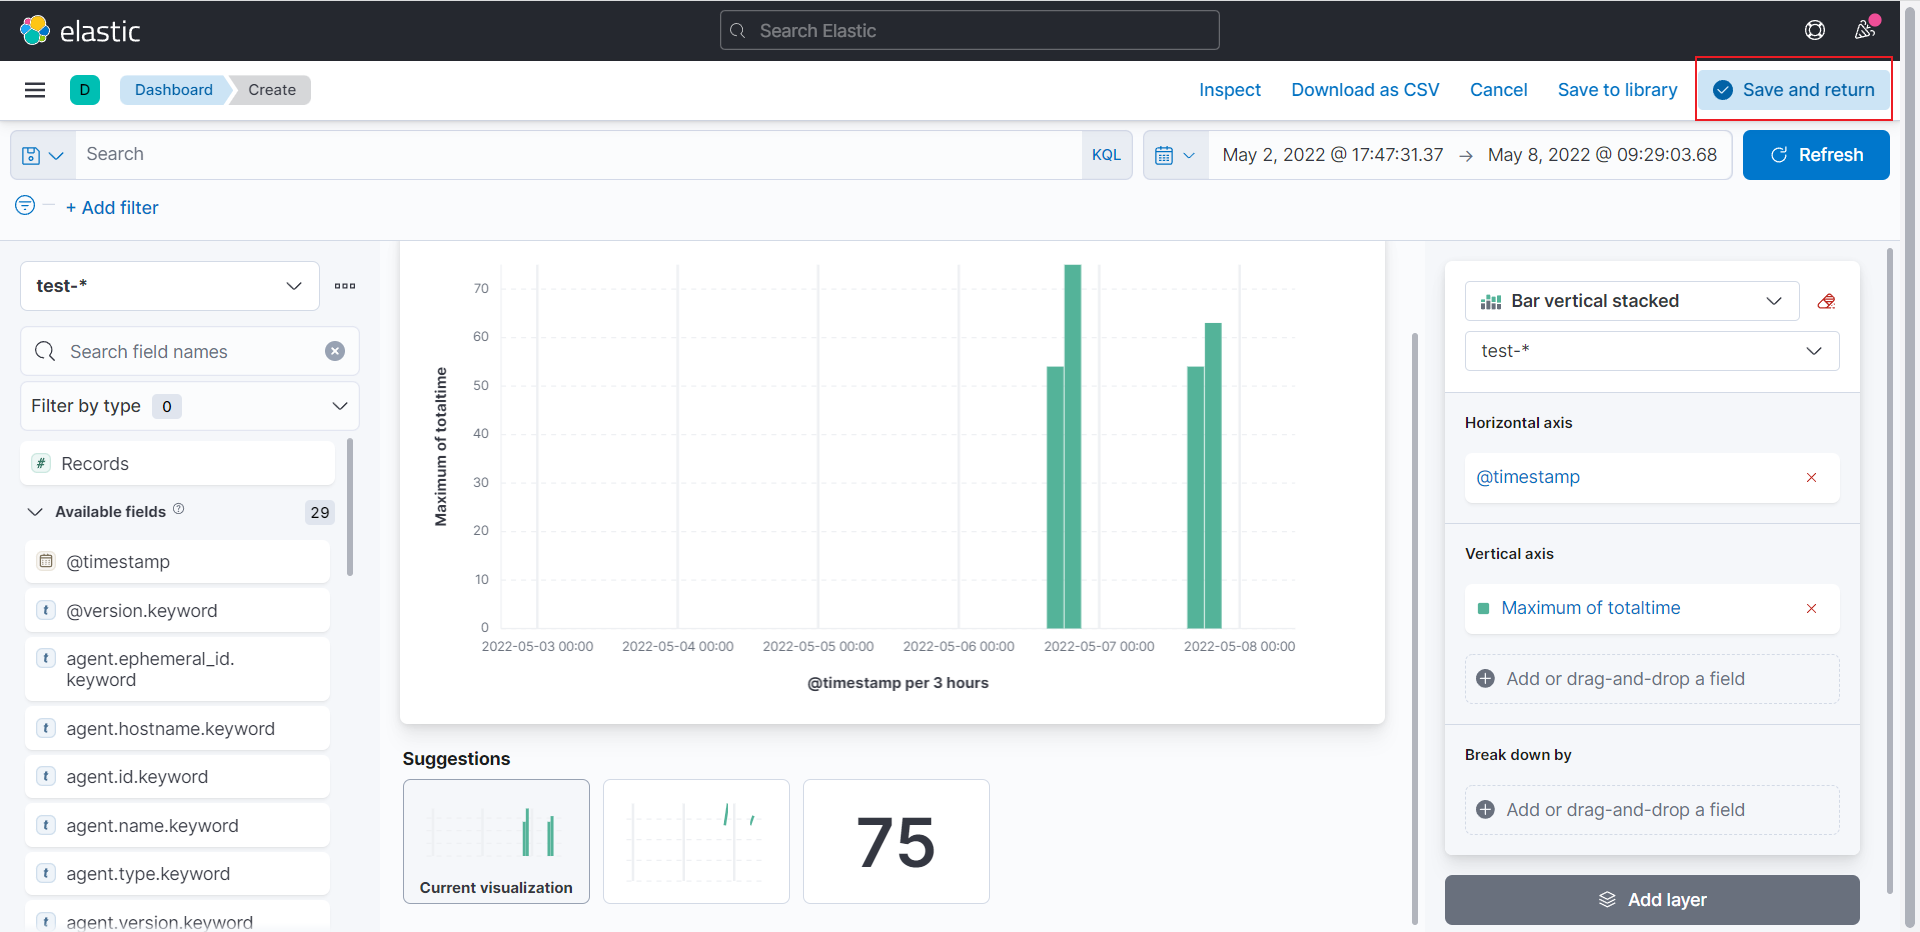
可以看到totaltime的统计数据显示出来了

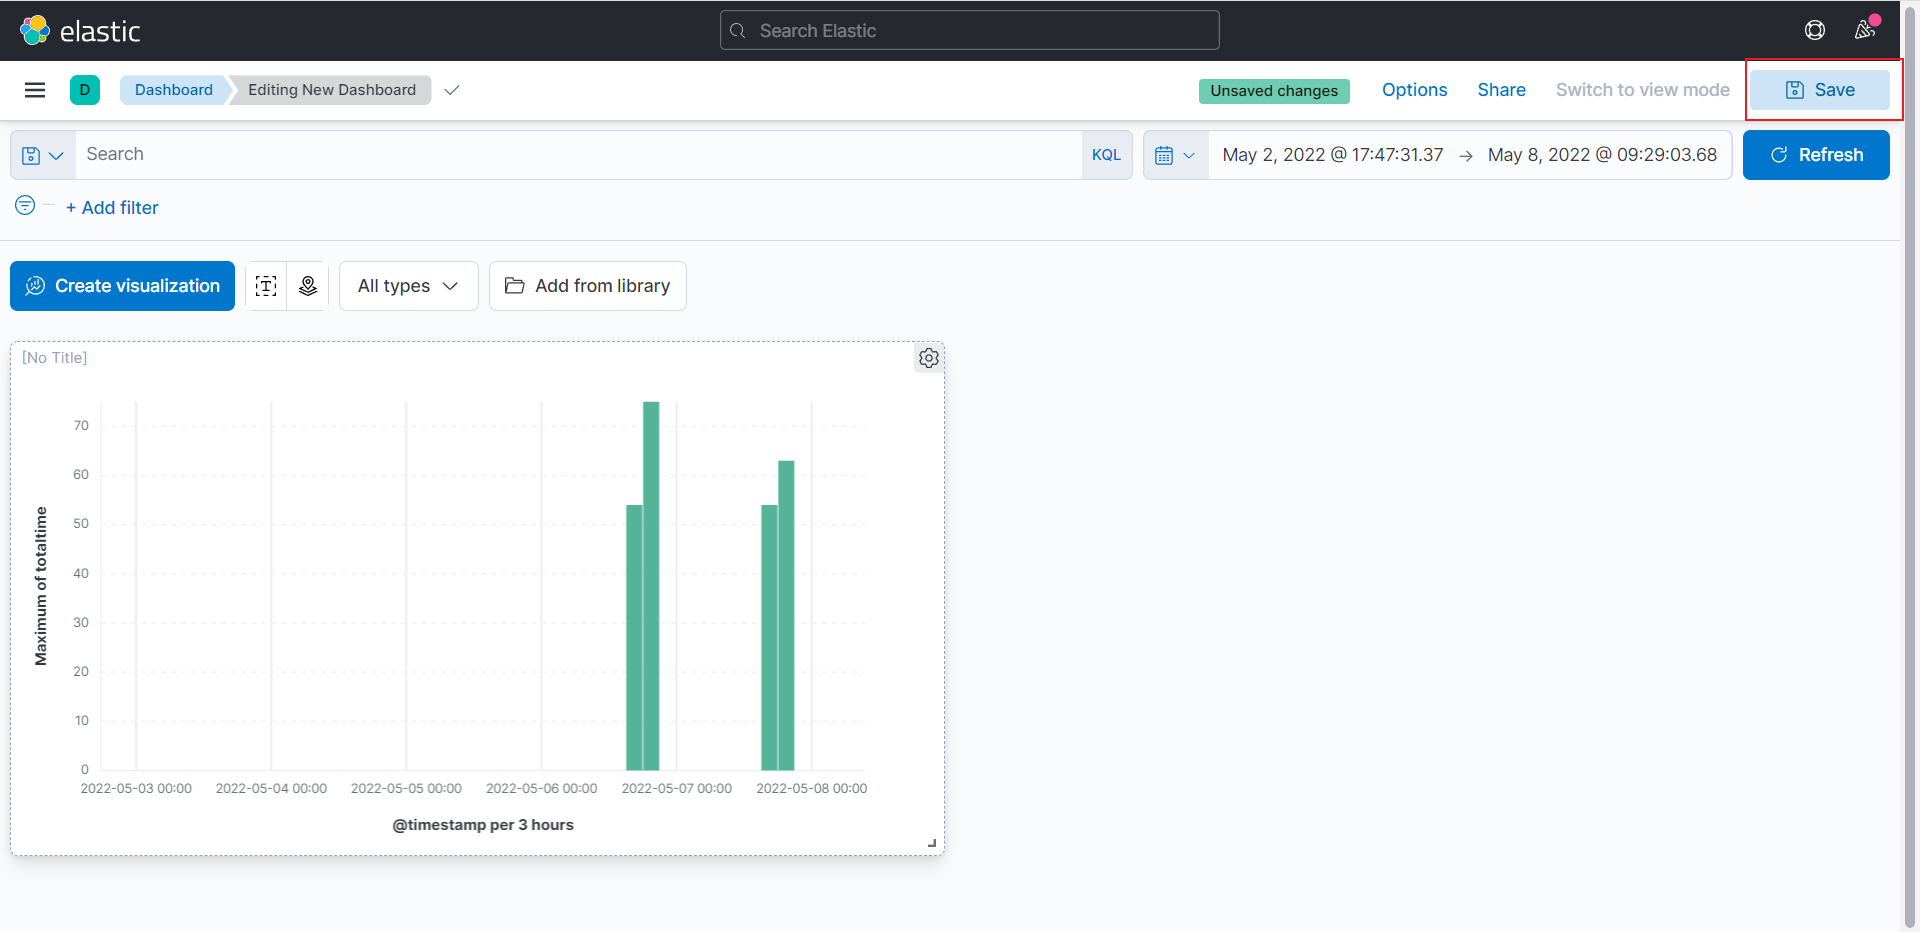
点击Save and return将图表保存
点击Save
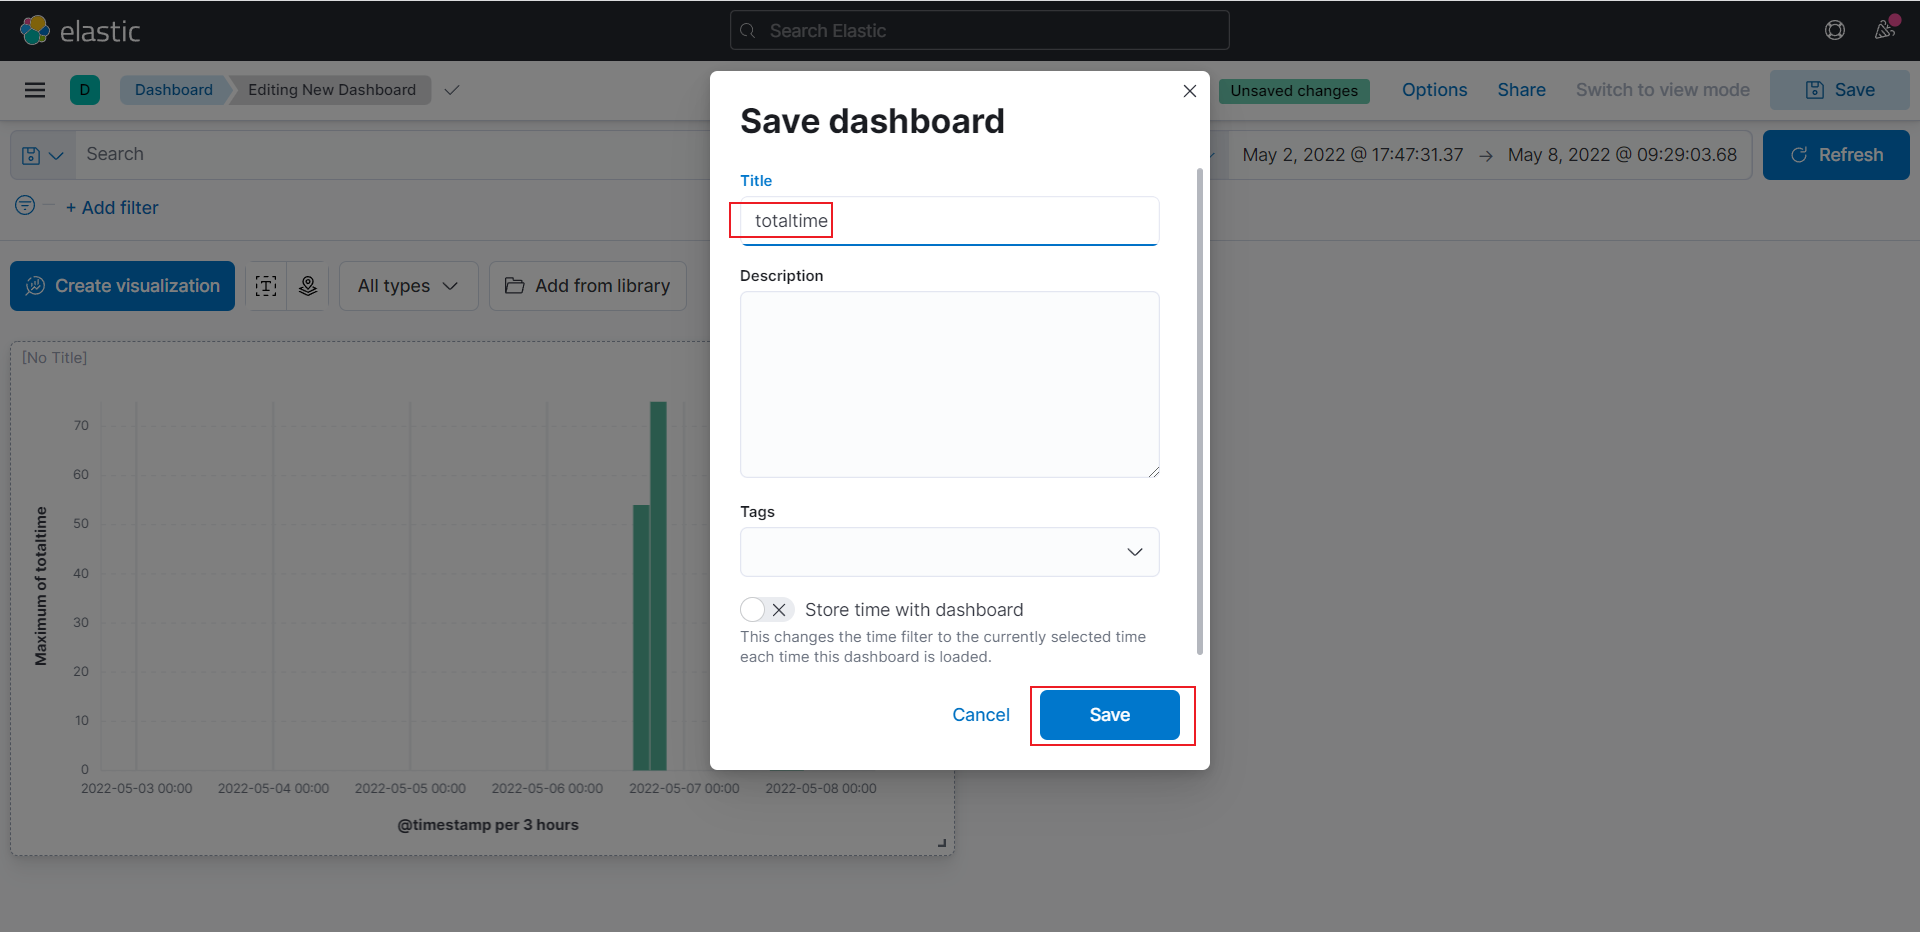
输入totaltime,点击Save保存
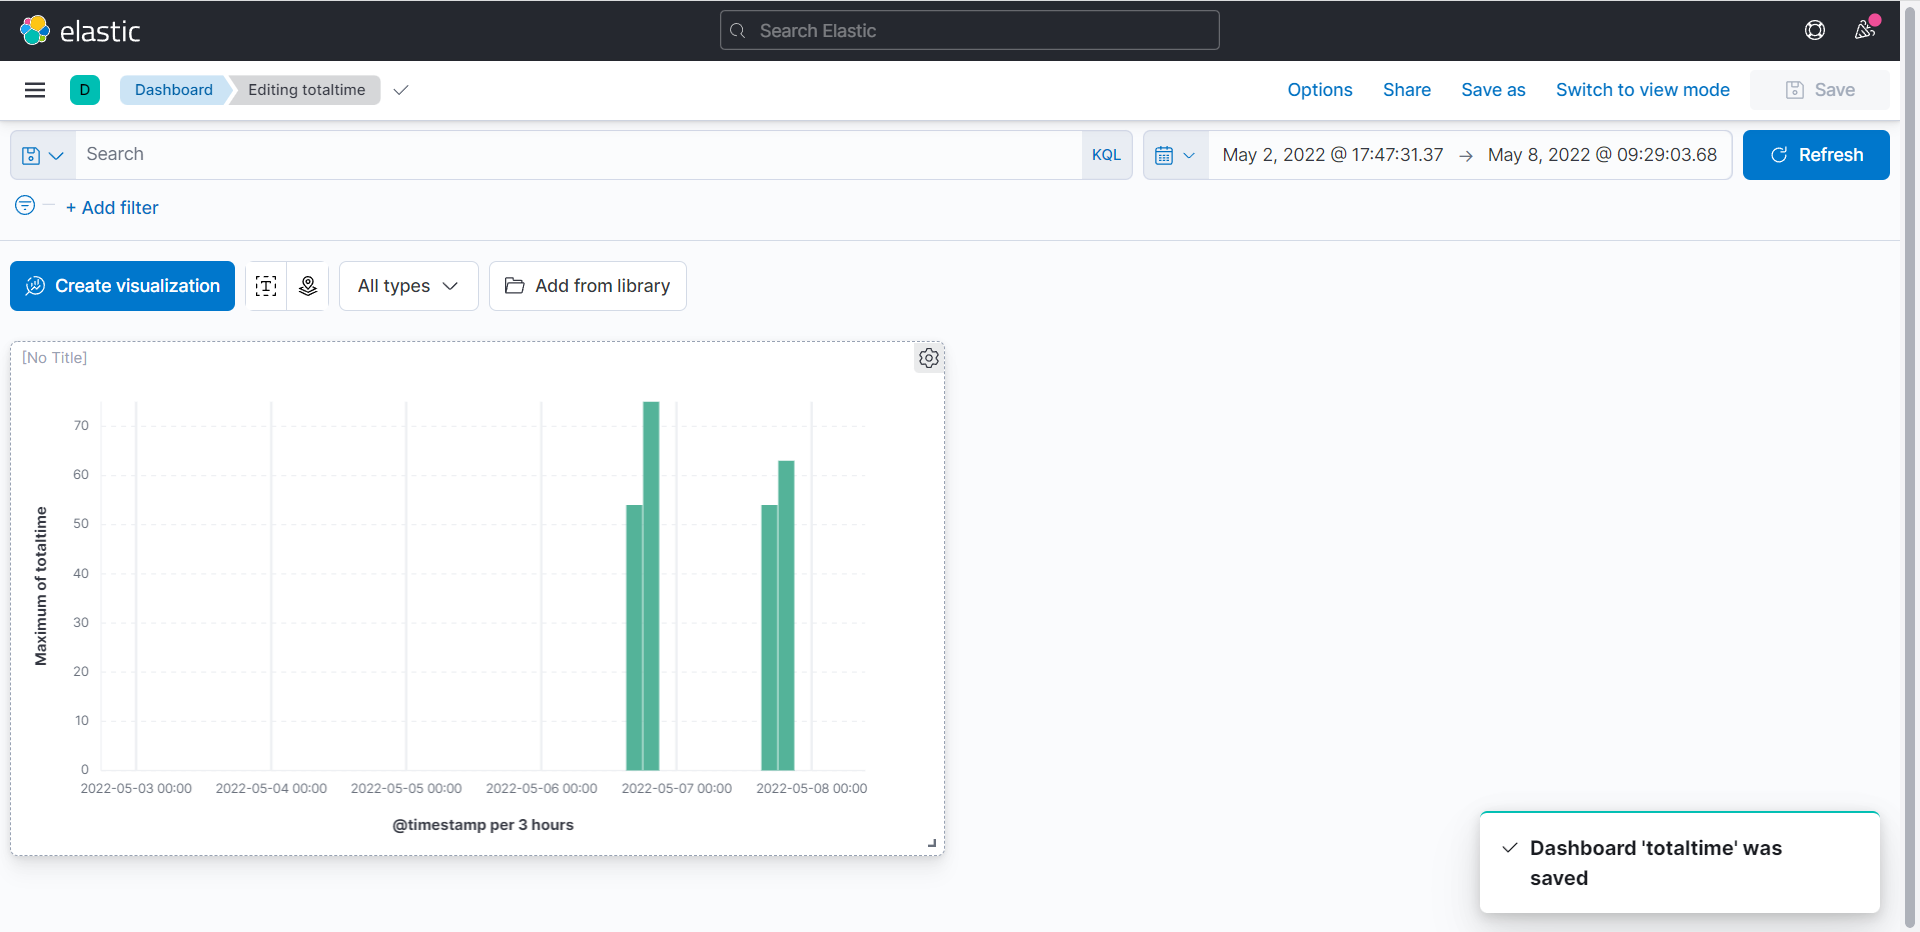
可以看到保存成功
点击totaltime可以直接进去创建的dashboard
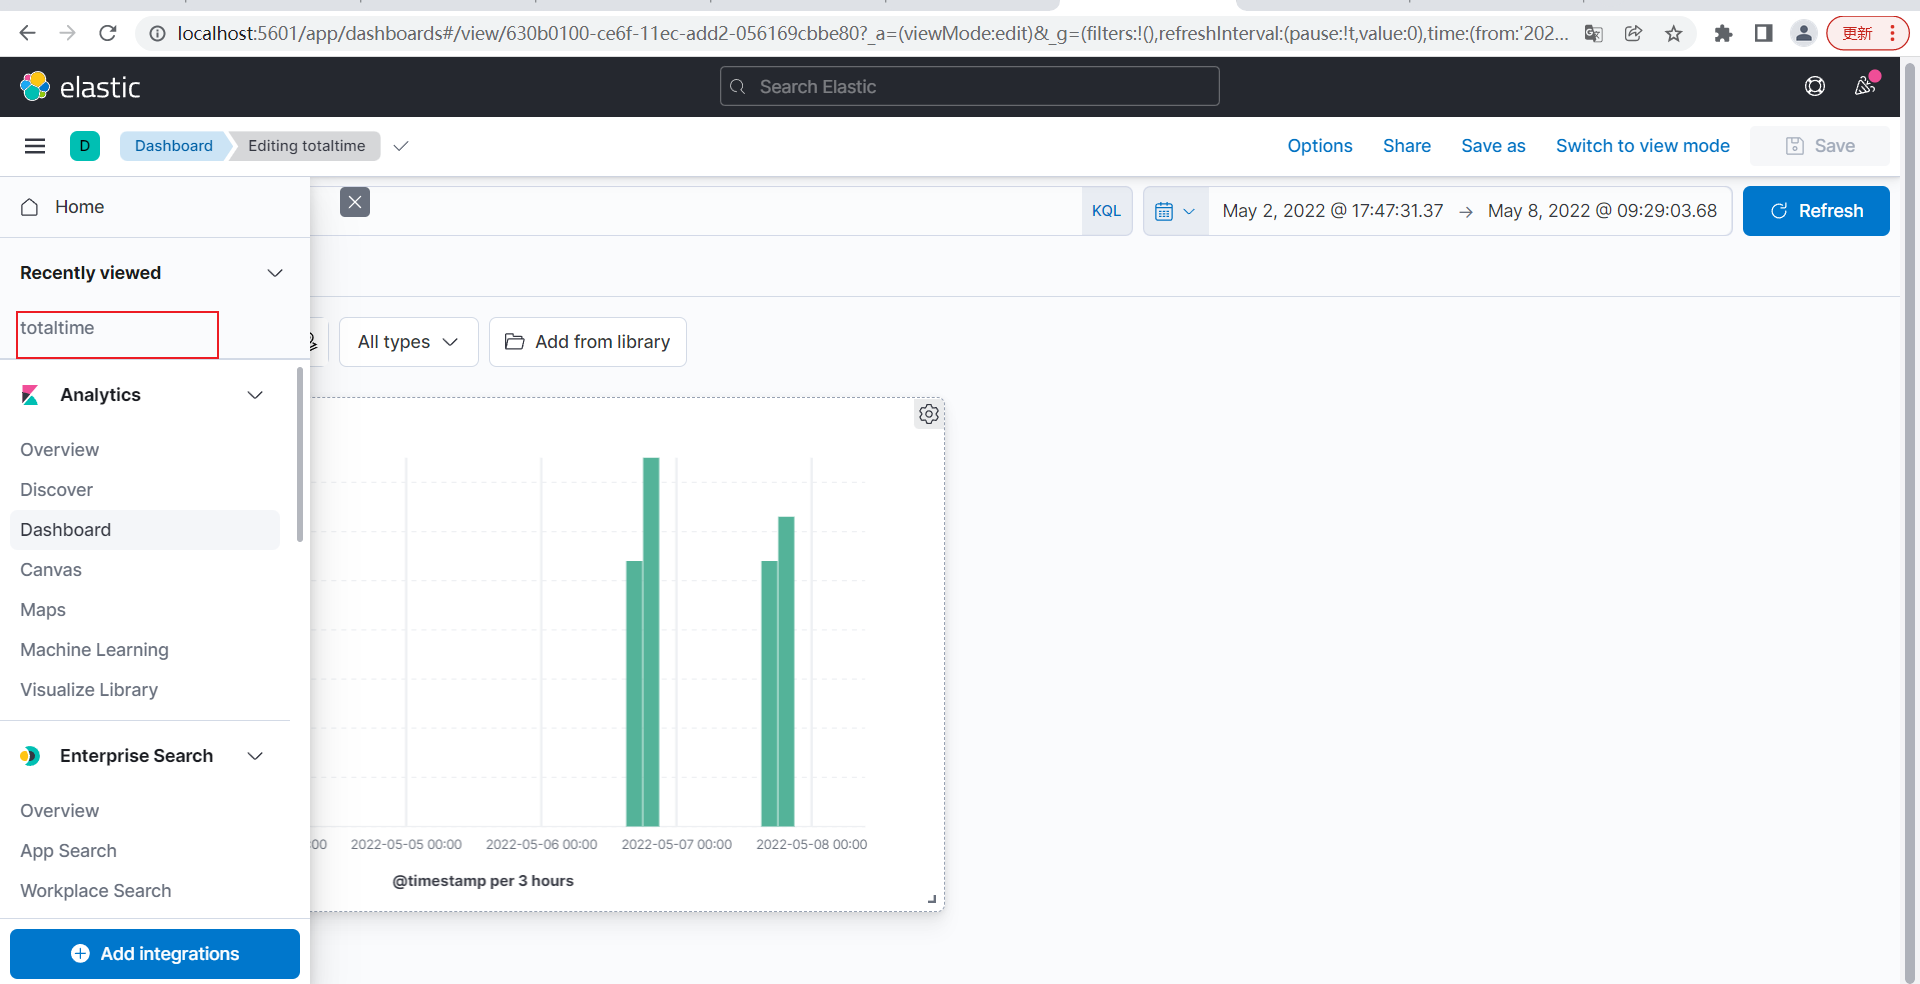
点击Edit lens可以重新进入
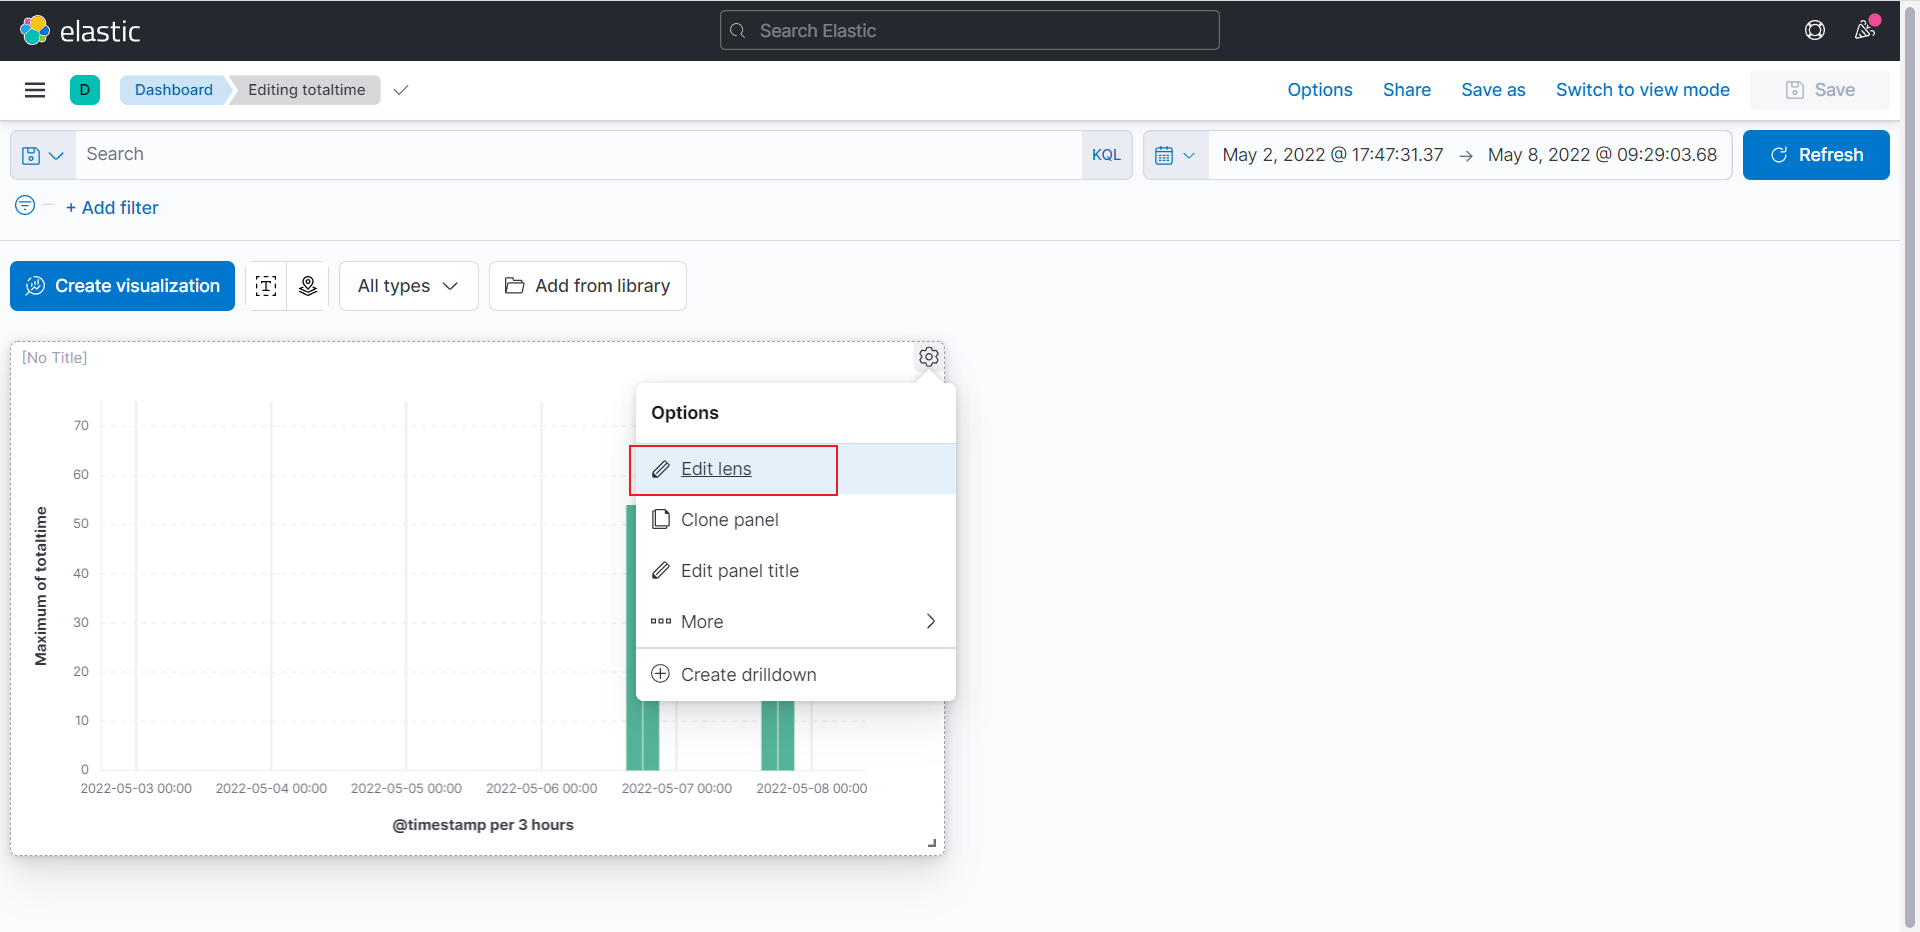
可以看到编辑的dashboard
创建Runtime script
如果刚开始没有通过logstash解析到关键字,后期也可以通过Runtime script解析到关键字,本章我们再次通过Runtime script解析totalTIme关键字
参考内容:https://www.elastic.co/guide/en/kibana/7.16/managing-index-patterns.html#runtime-fields
发送的日志消息如下
1 | {"timestamp":"2022-05-06T17:23:25.365+08:00", "message":"tc-com.net - - 192.168.12.58 192.168.12.58 192.168.15.135 80 GET 200 /geccess/services/capability/L6JN4255 ?pageIndex=1&pageSize=2000&vehicleType=0 21067 17 totalTime:54ms"} |
点击Stack Management
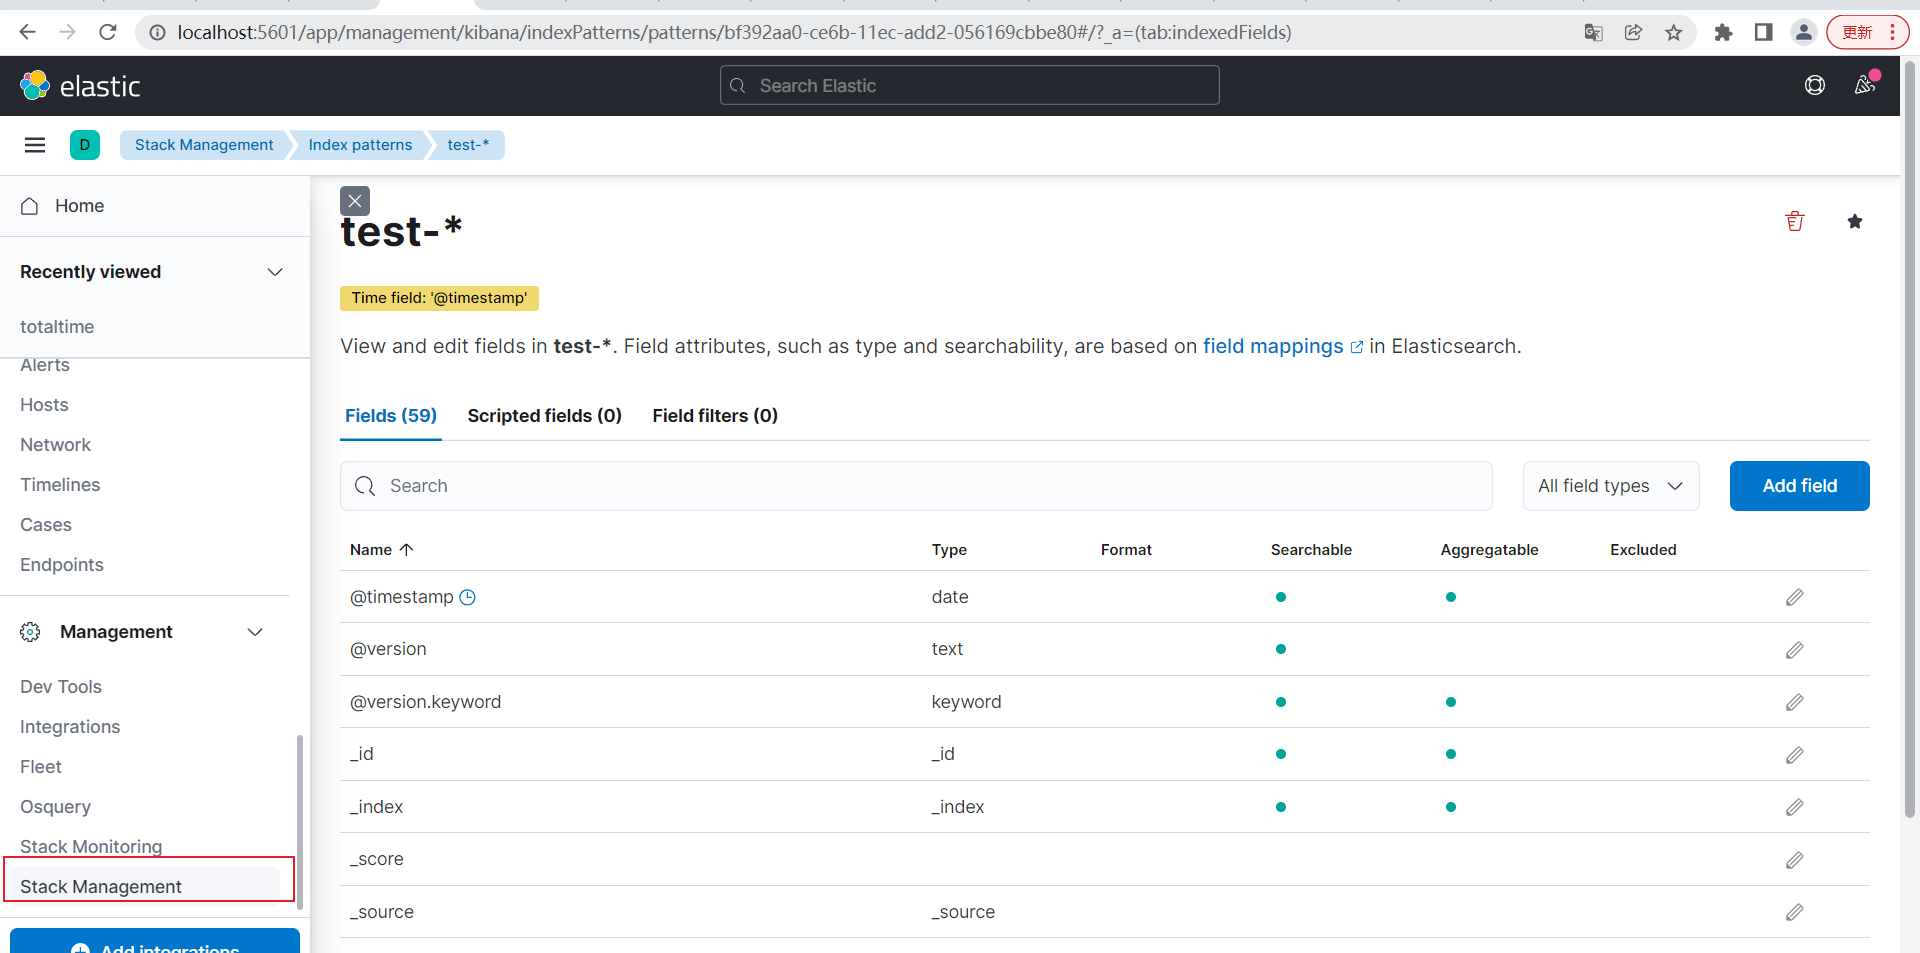
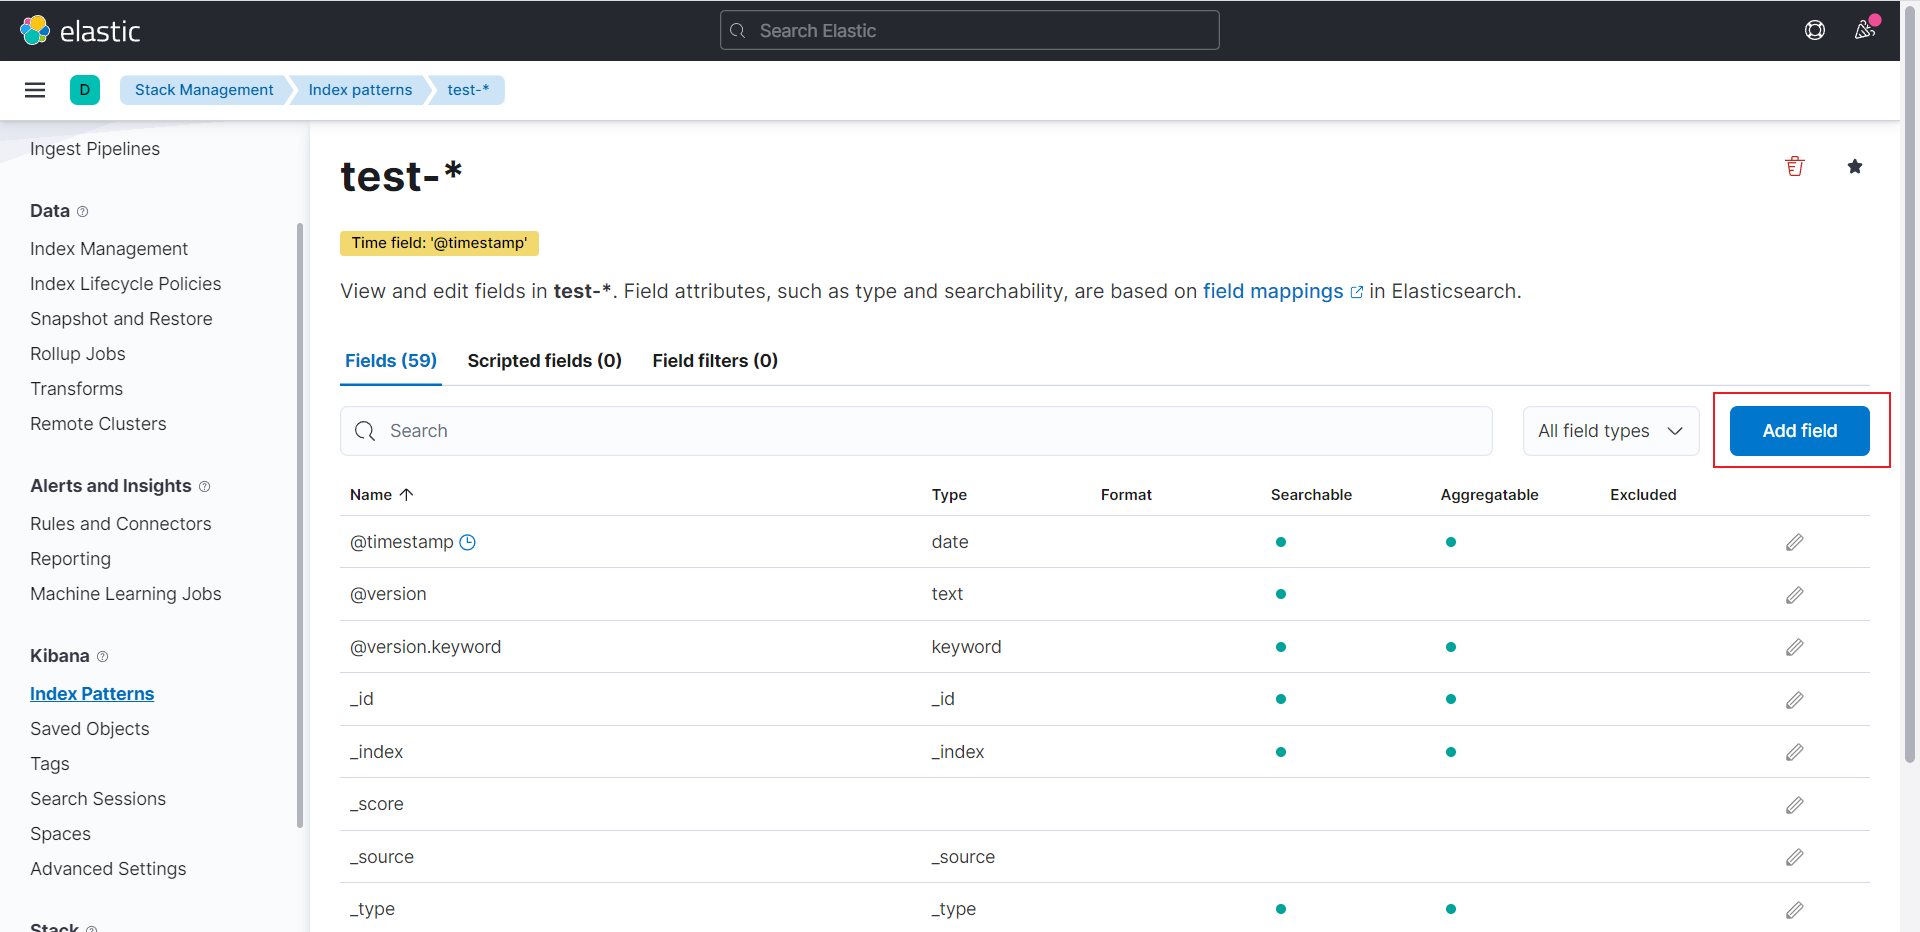
点击Index Patterns,选择test-*索引
点击Add field
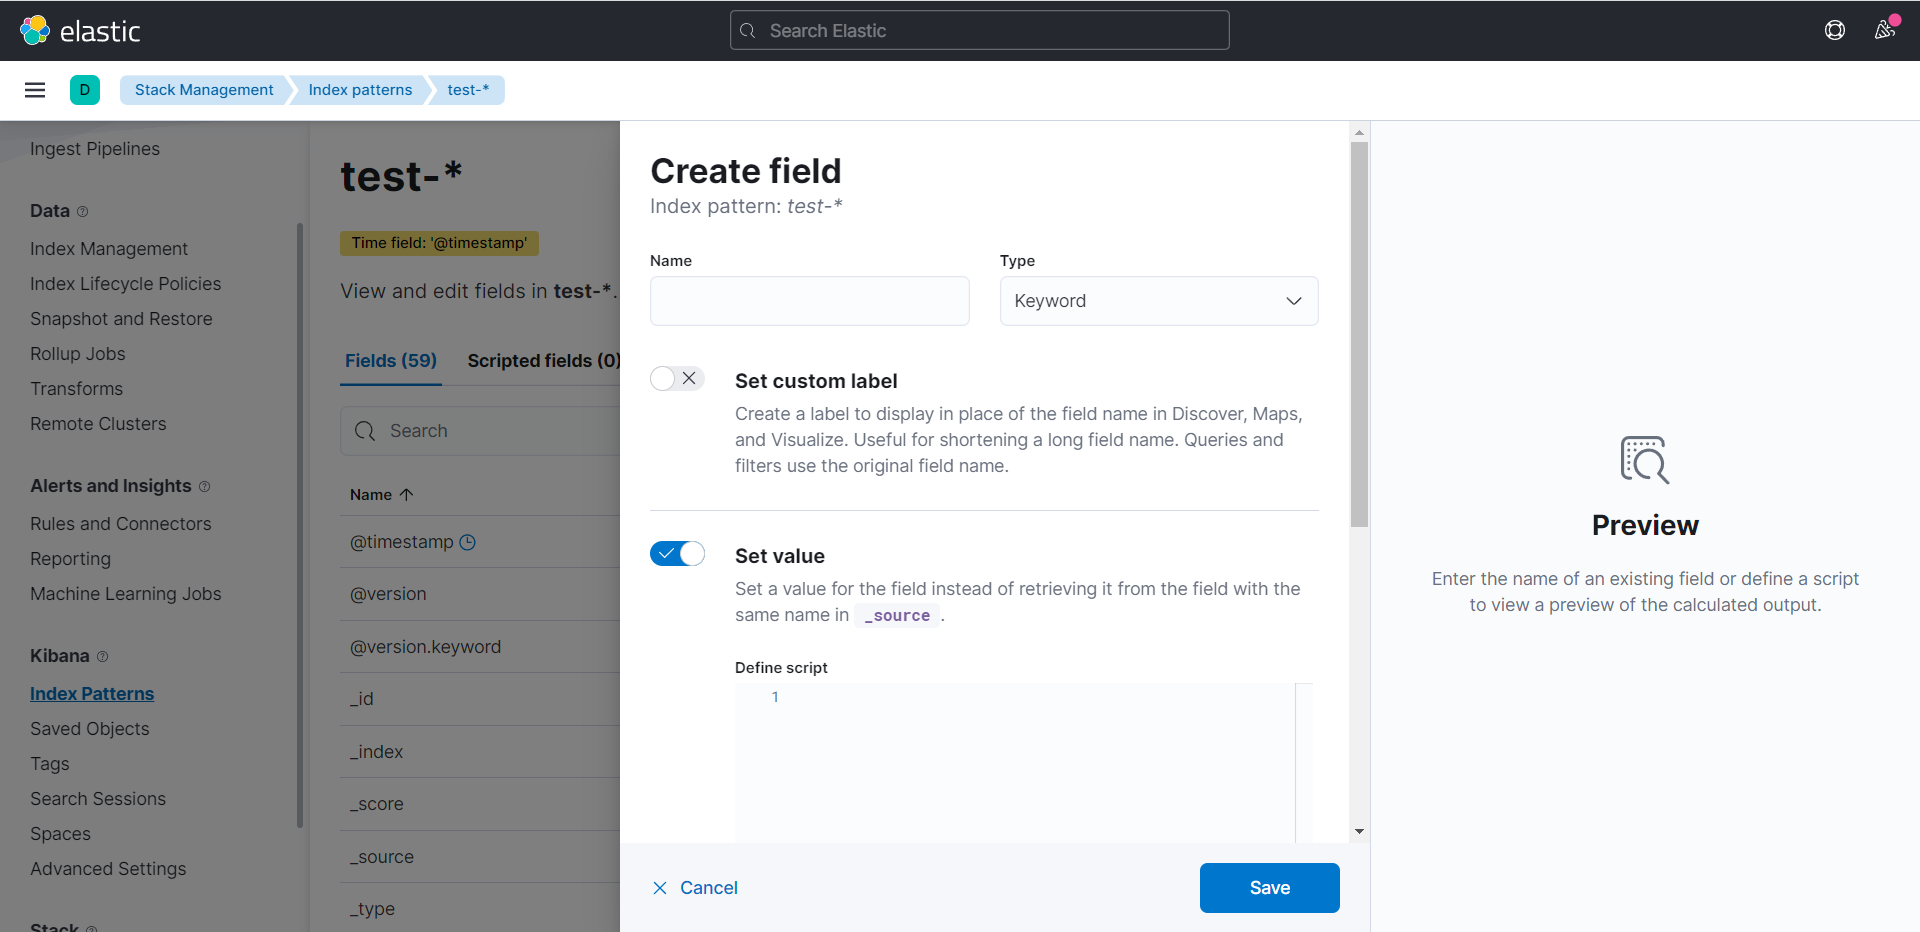
点击Set value
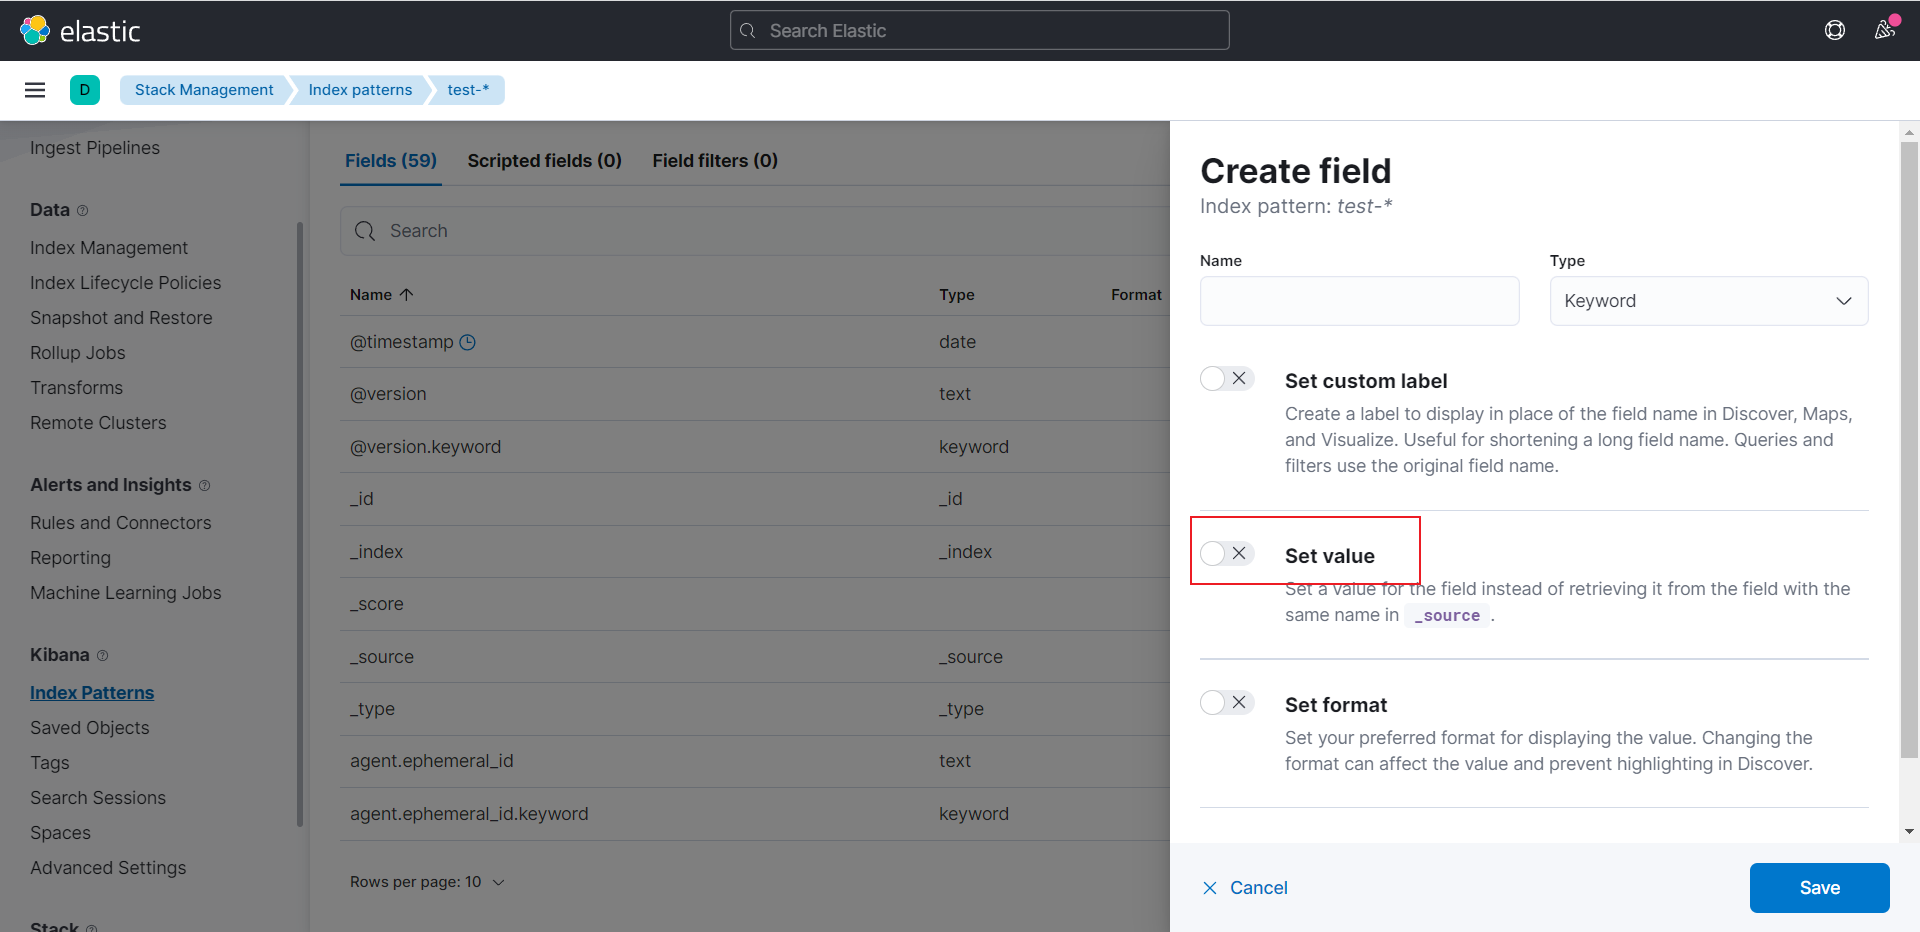
可以看到Create field内容如下
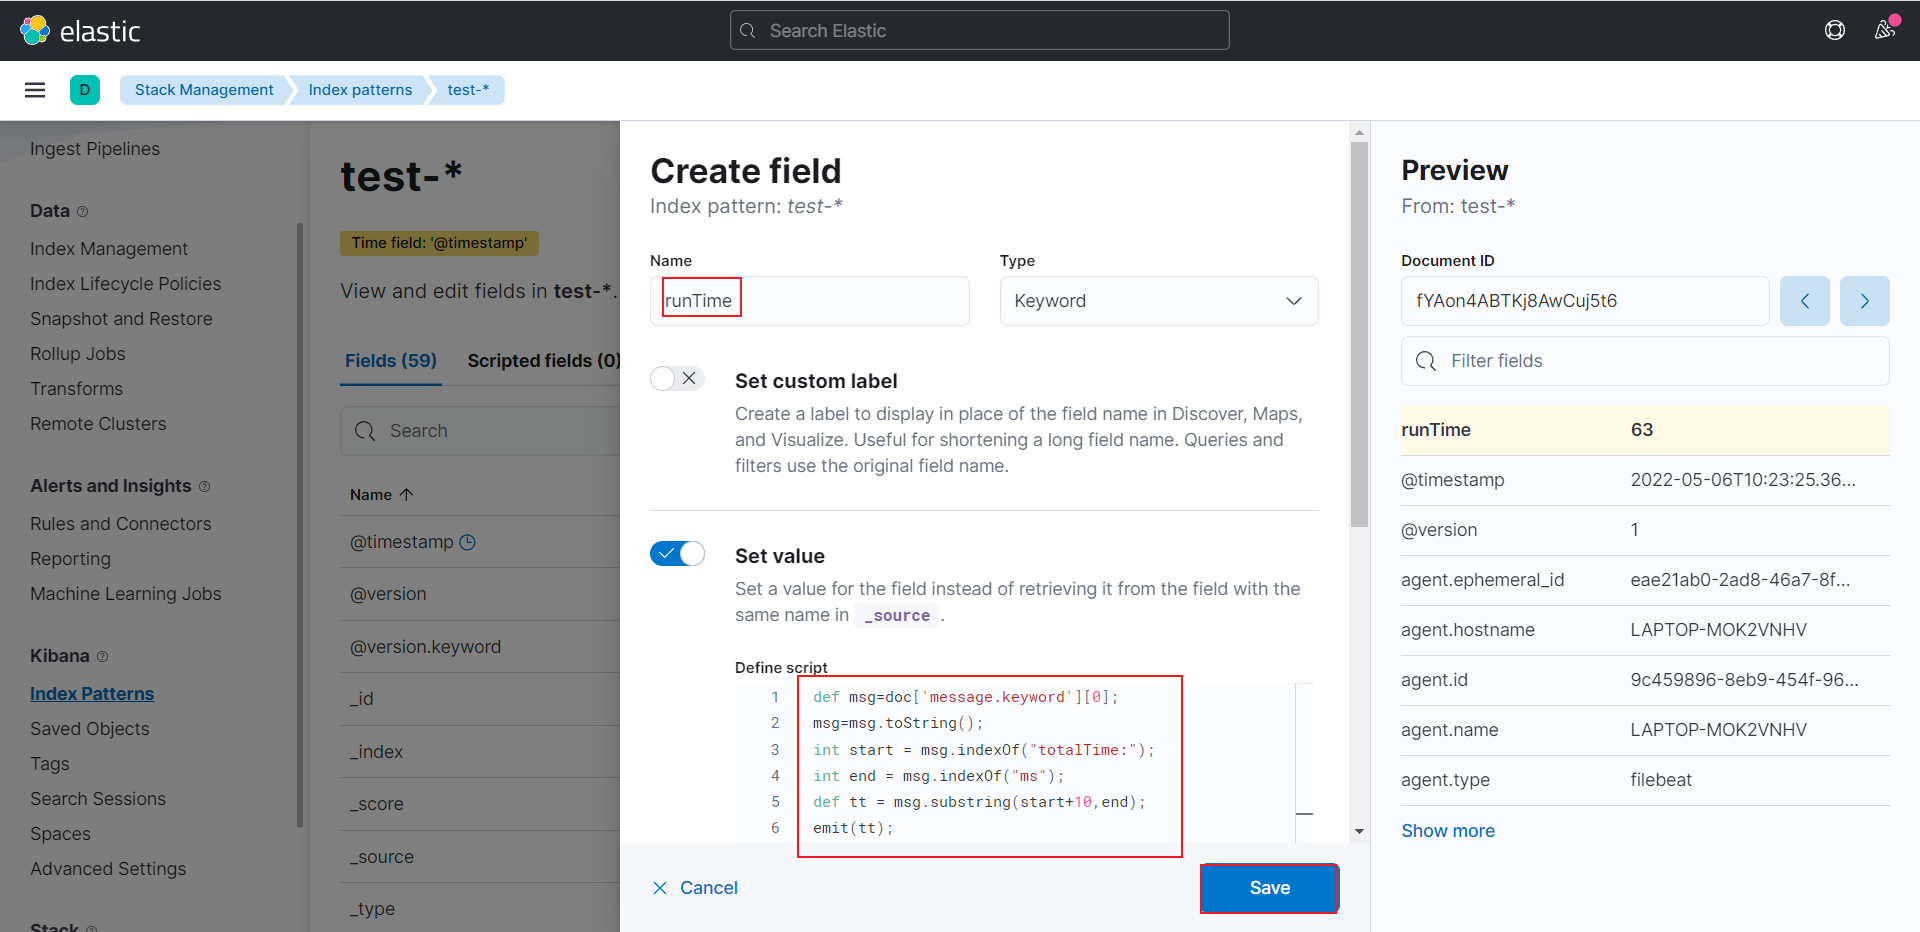
Name输入runTime
Define scipt输入如下内容
1 | def msg=doc['message.keyword'][0]; |
可以看到右侧实时计算出来了tunTime的值为63
点击Save
搜索runTime可以看到关键字已经创建
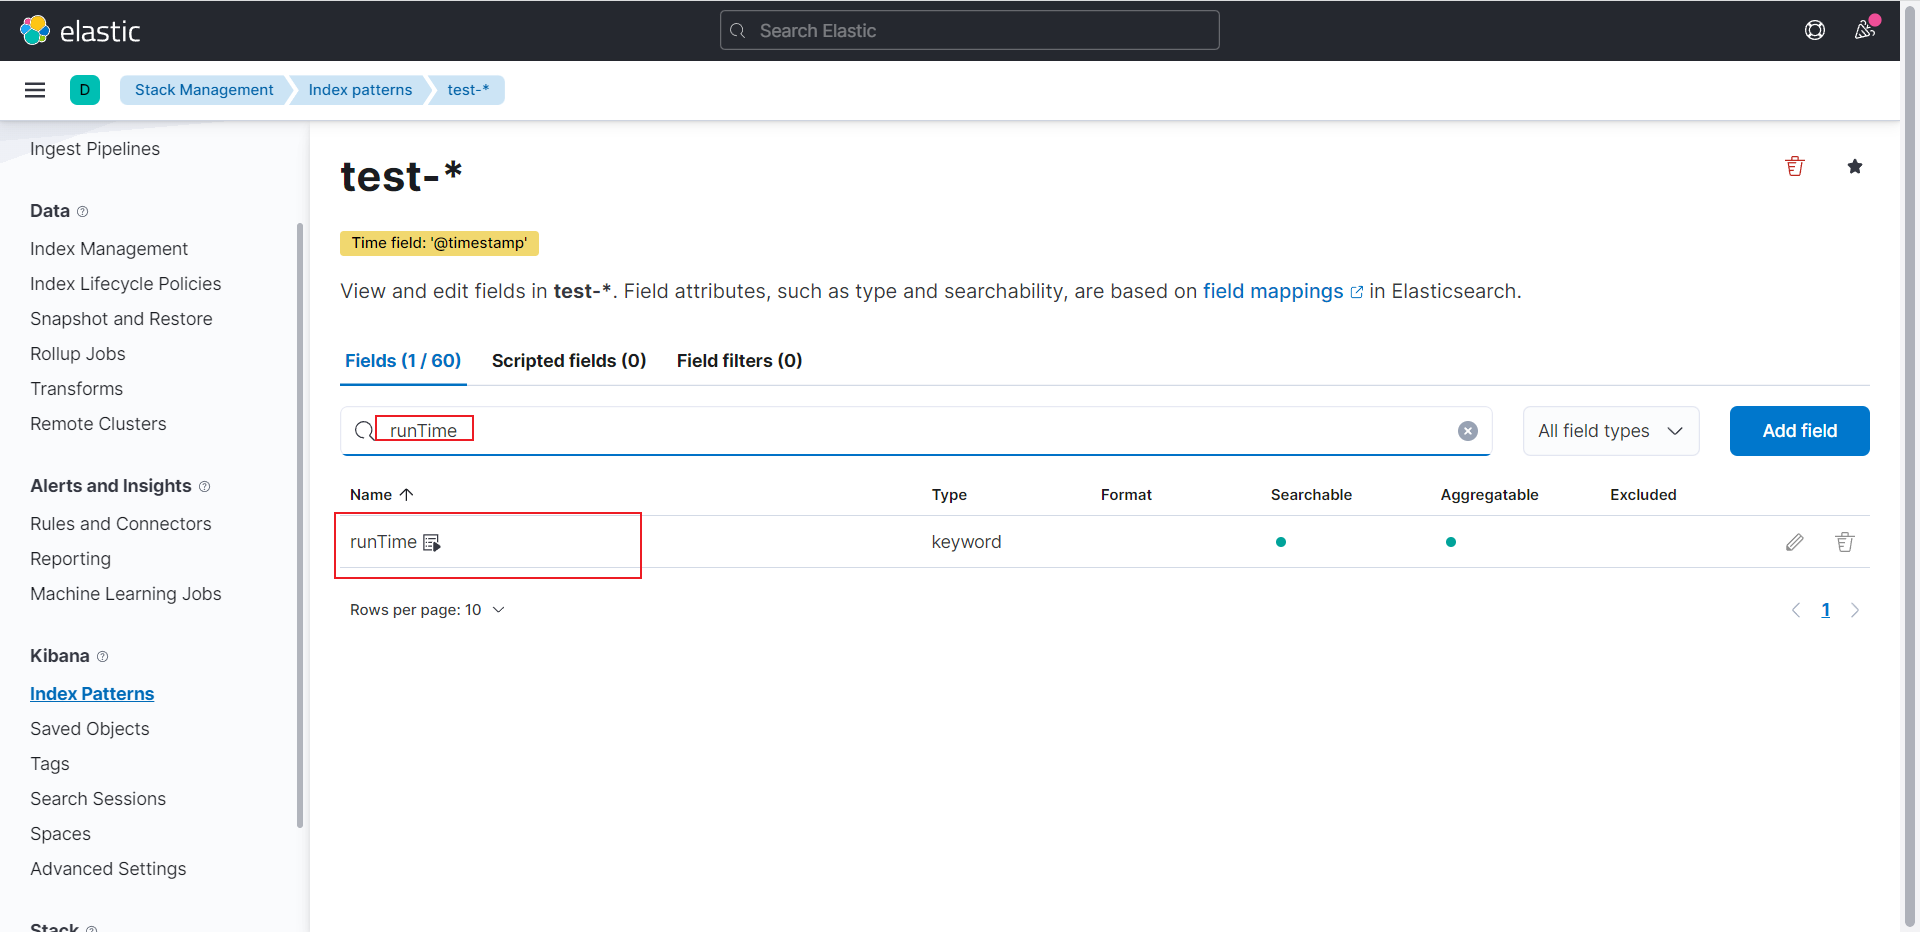
点击Discover
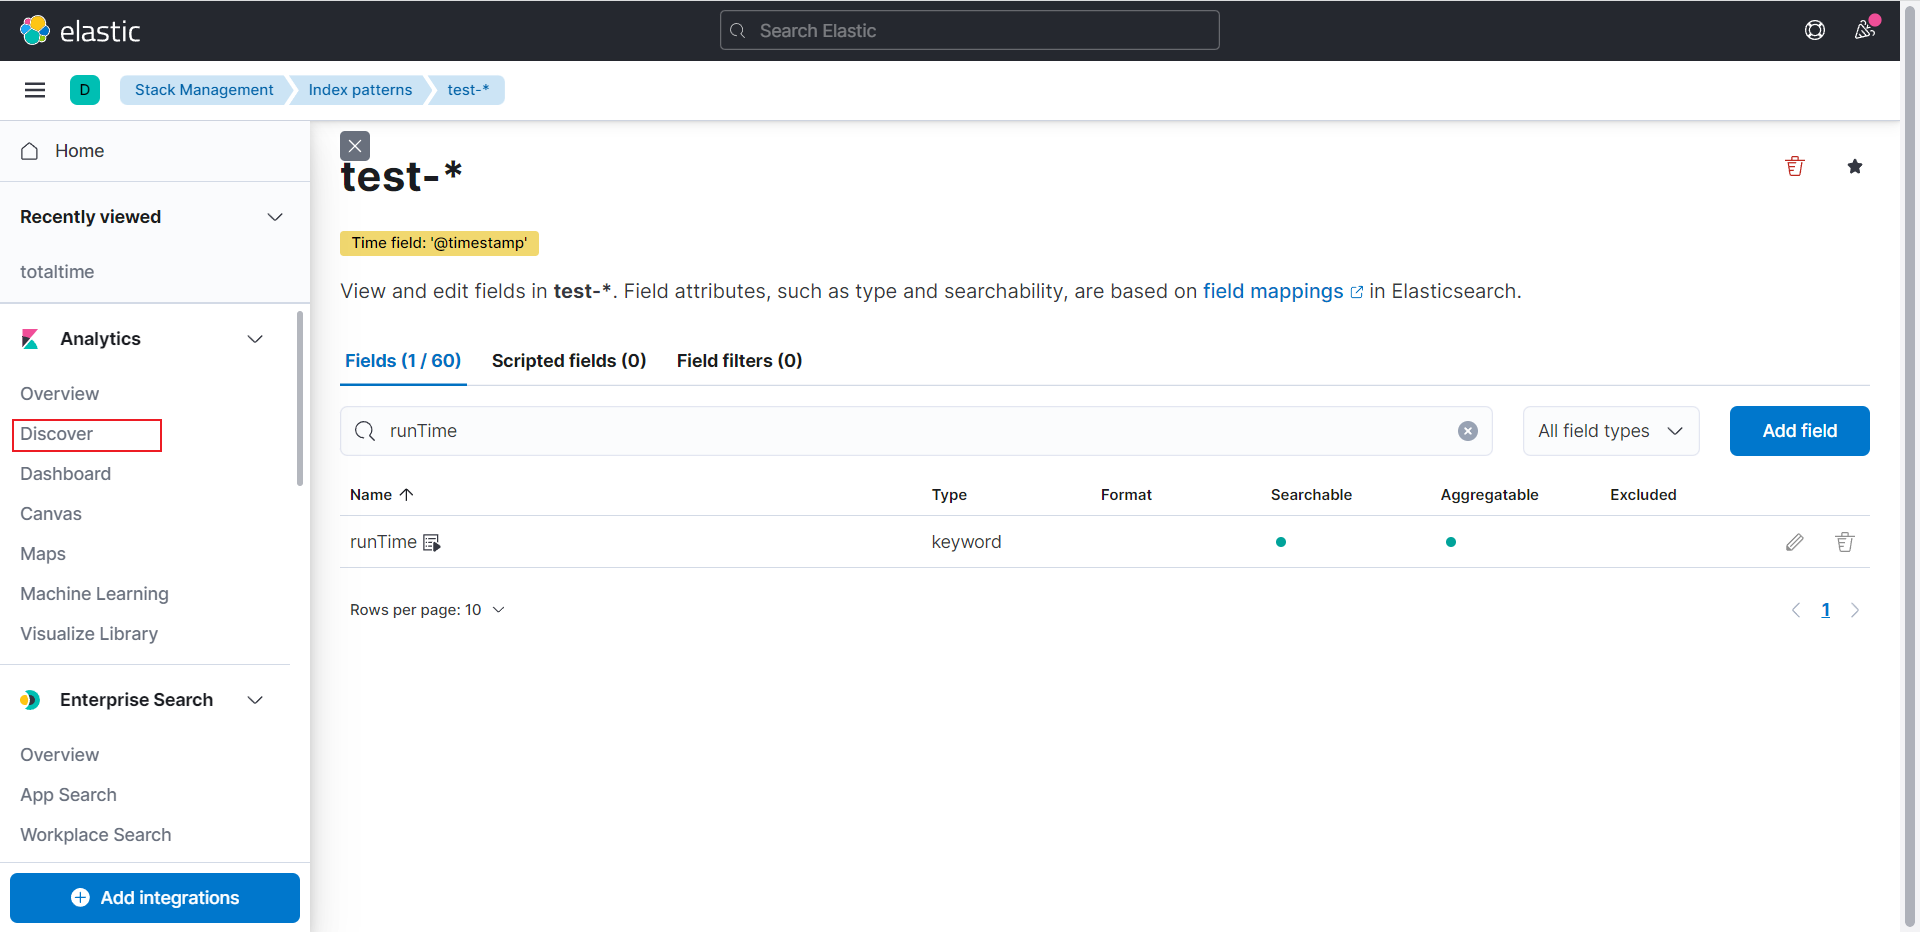
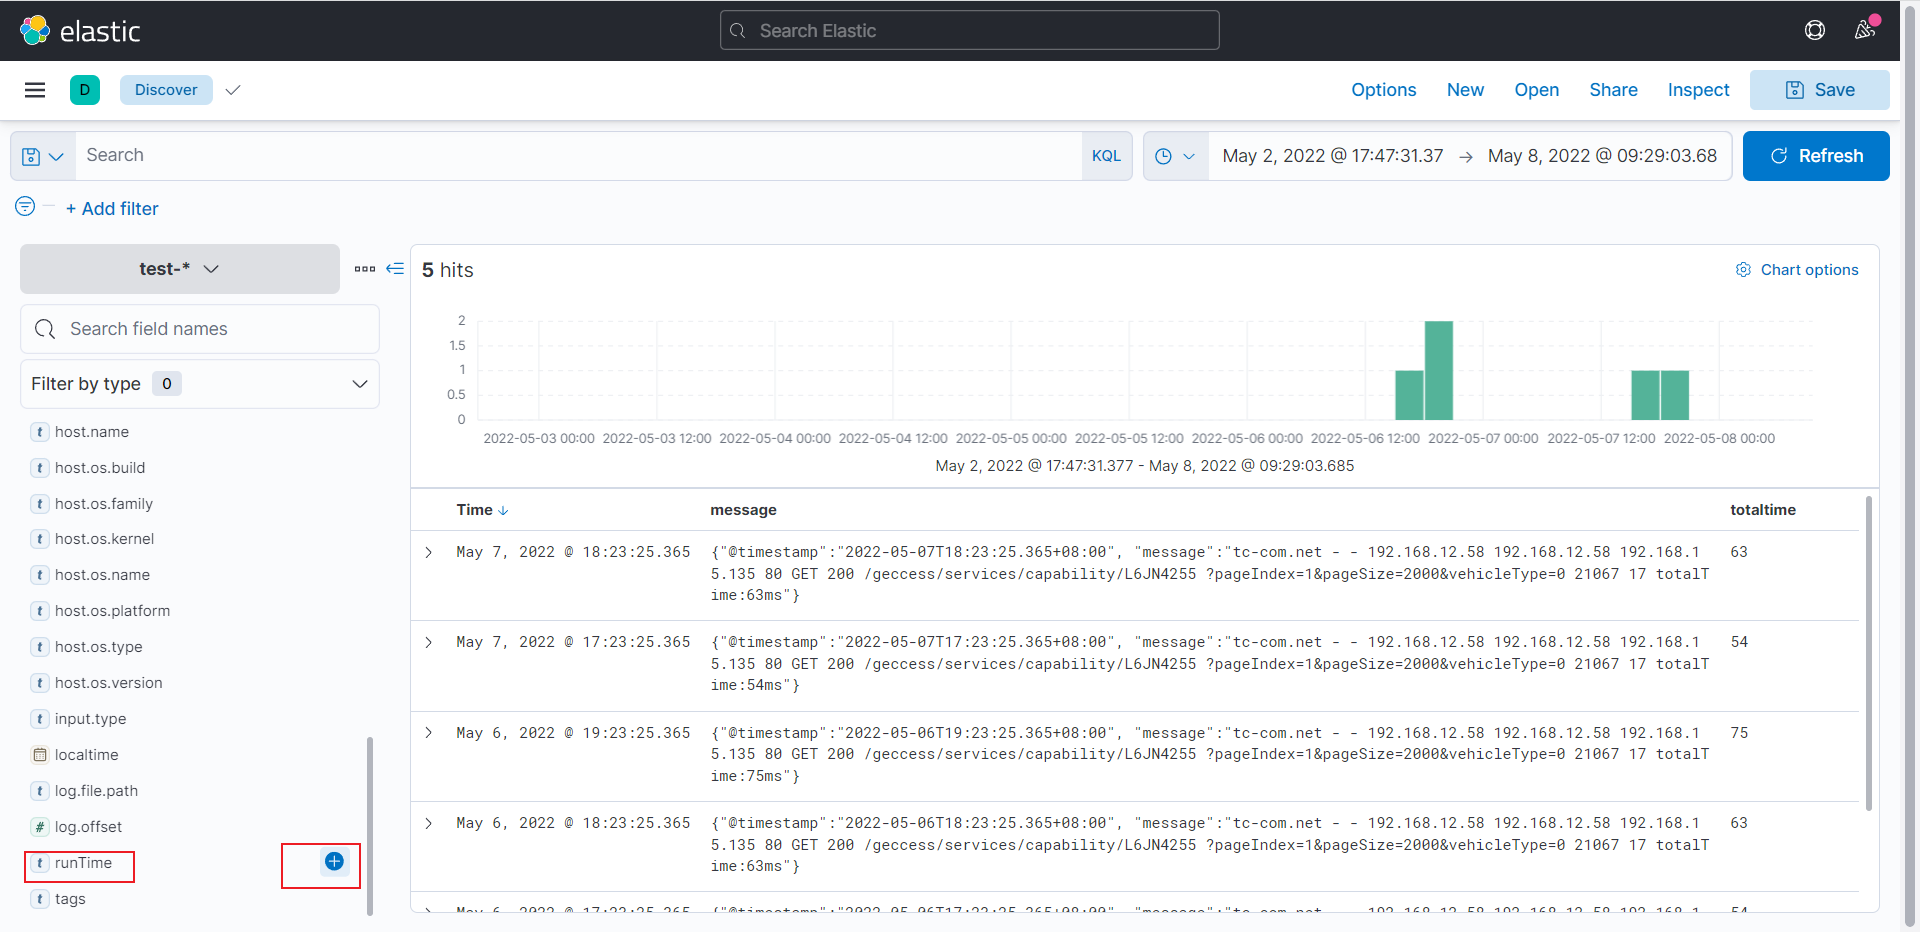
可以runTime已经显示出来了,点击加号
可以看到Selected fields中有runTime,右边也显示出来了
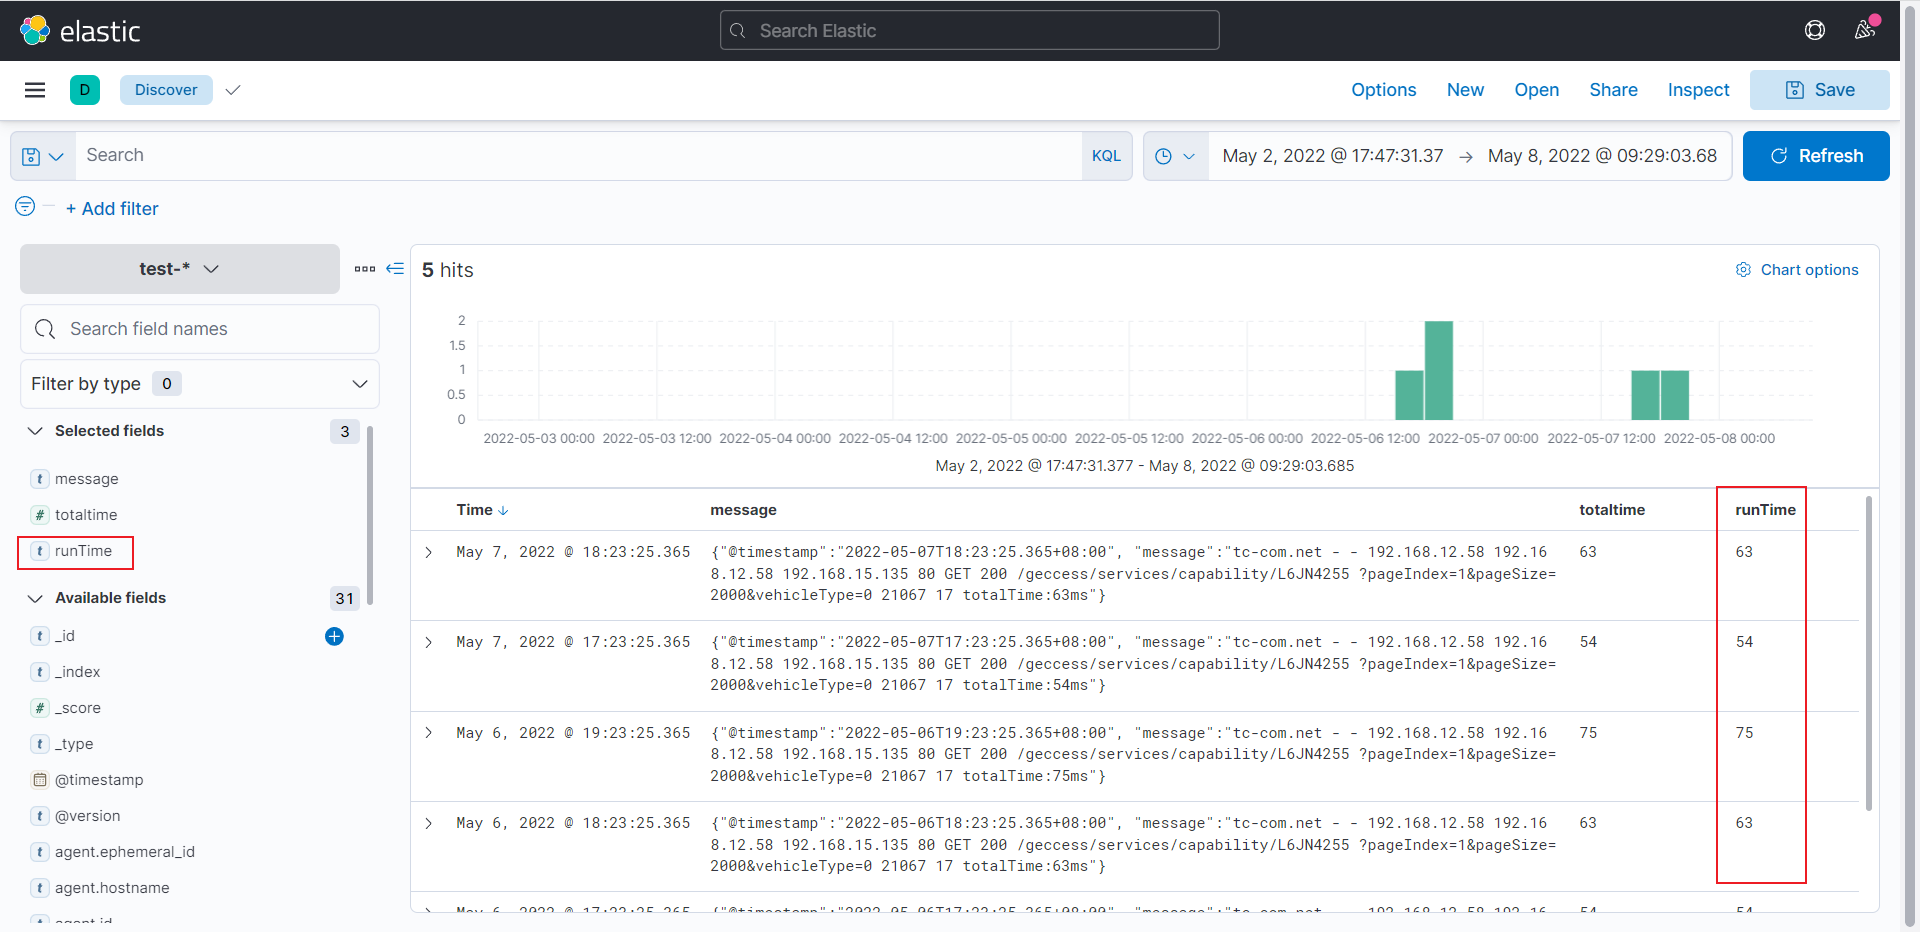
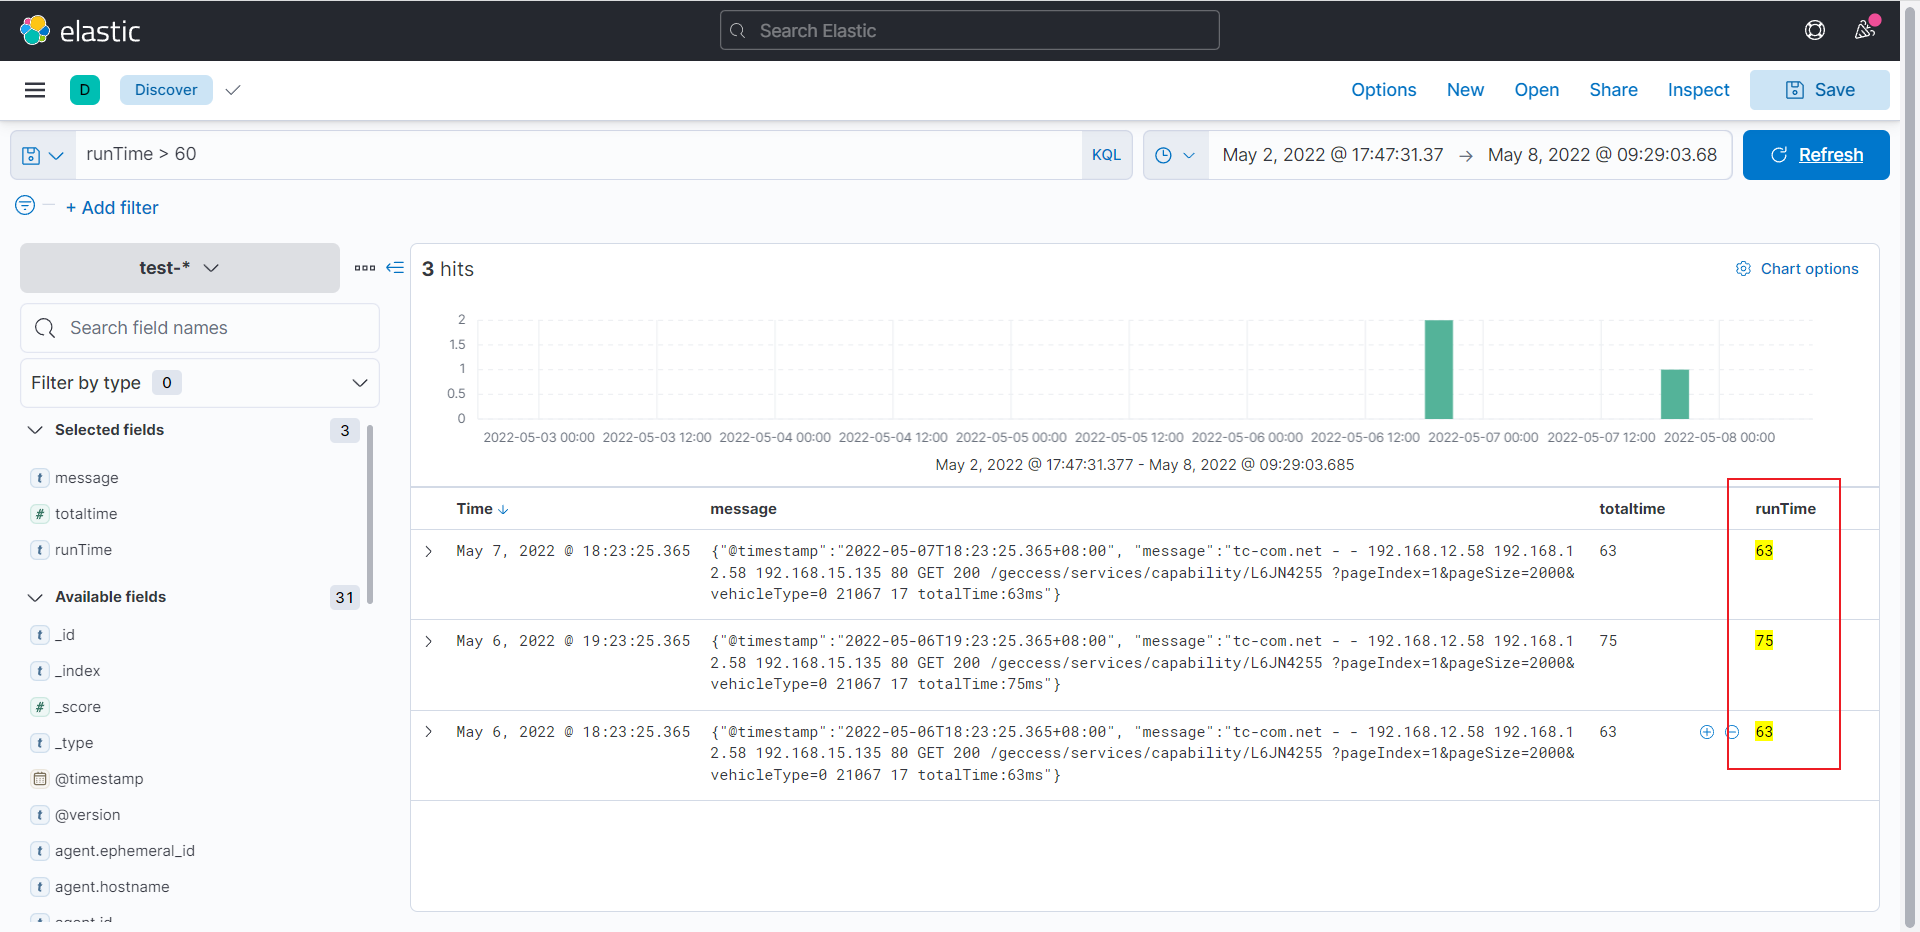
输入runTime>60,点击Update
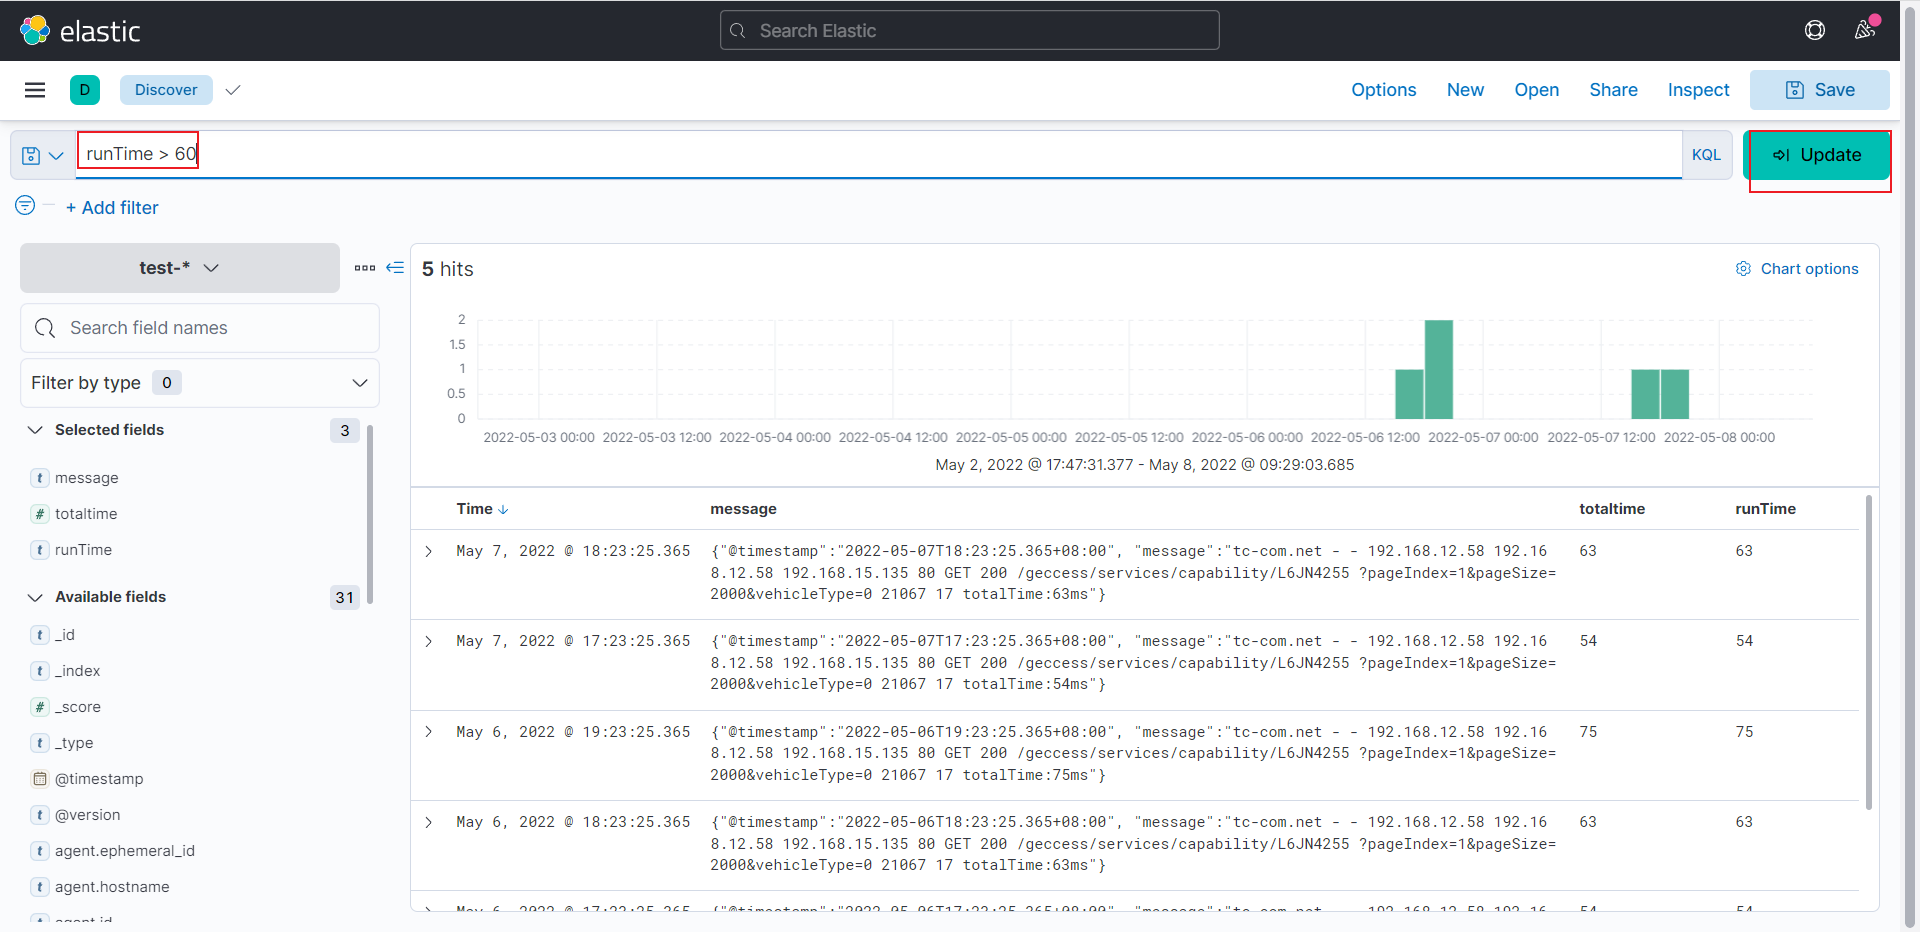
可以看到执行成功
curator删除过期索引数据
安装curator(window版本)
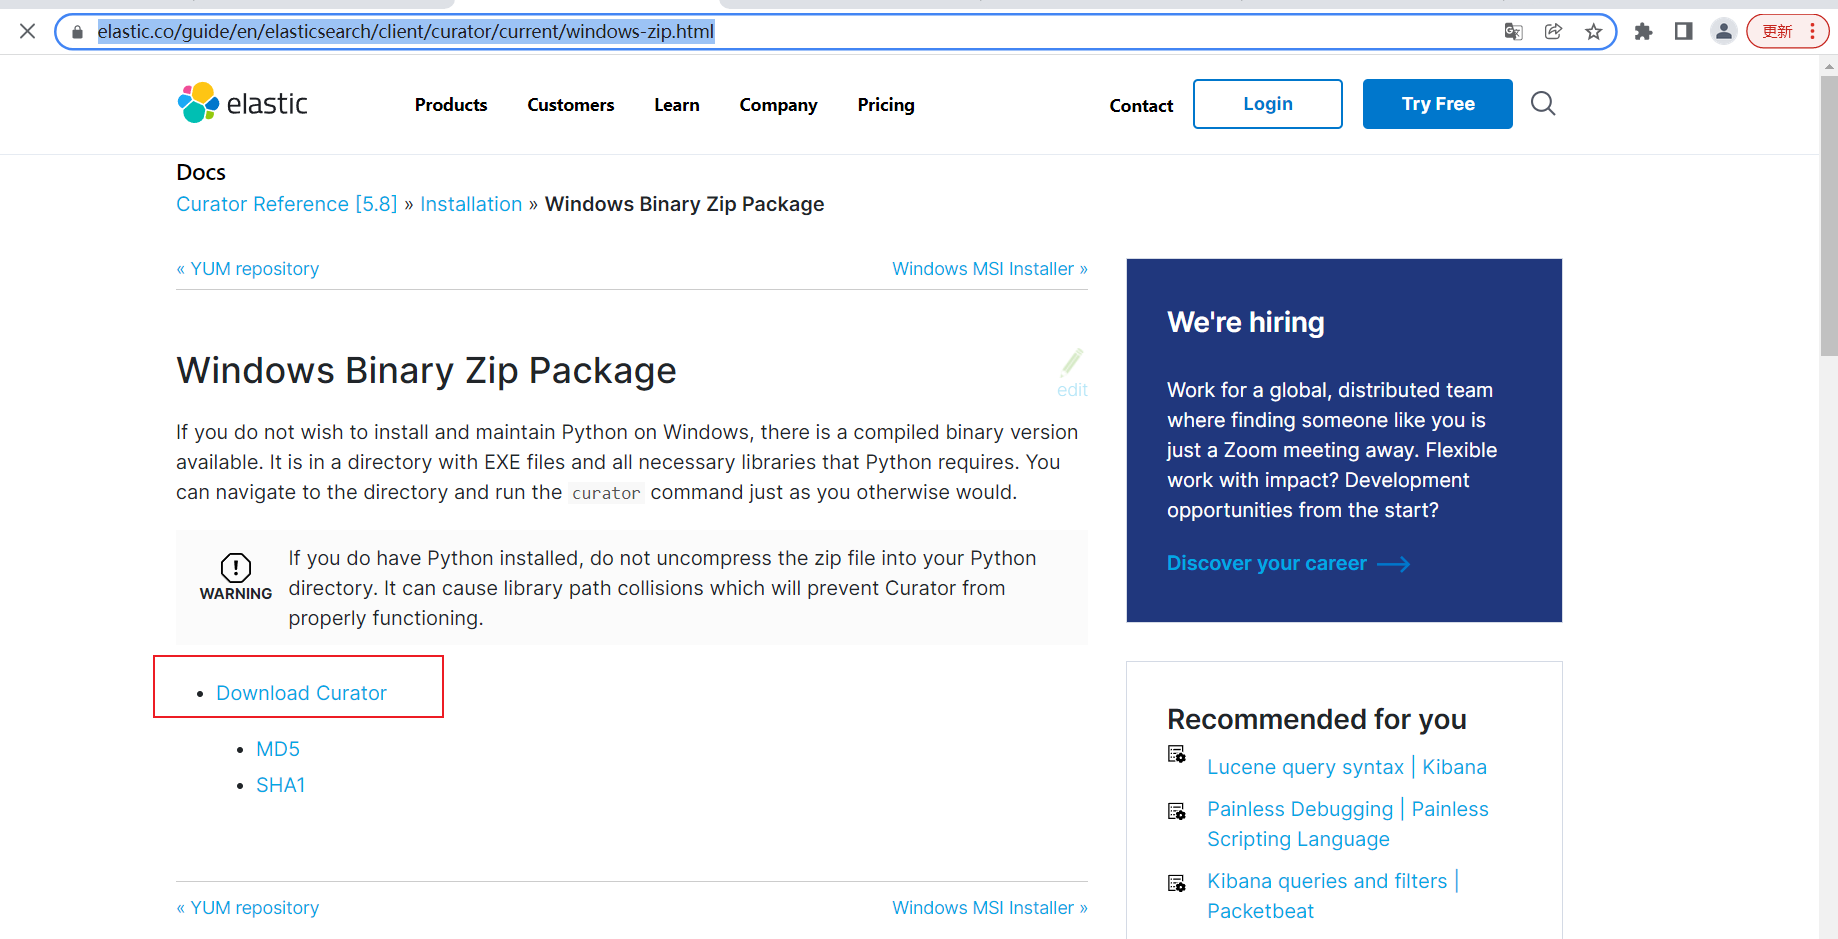
访问网站https://www.elastic.co/guide/en/elasticsearch/client/curator/current/windows-zip.html
点击下载
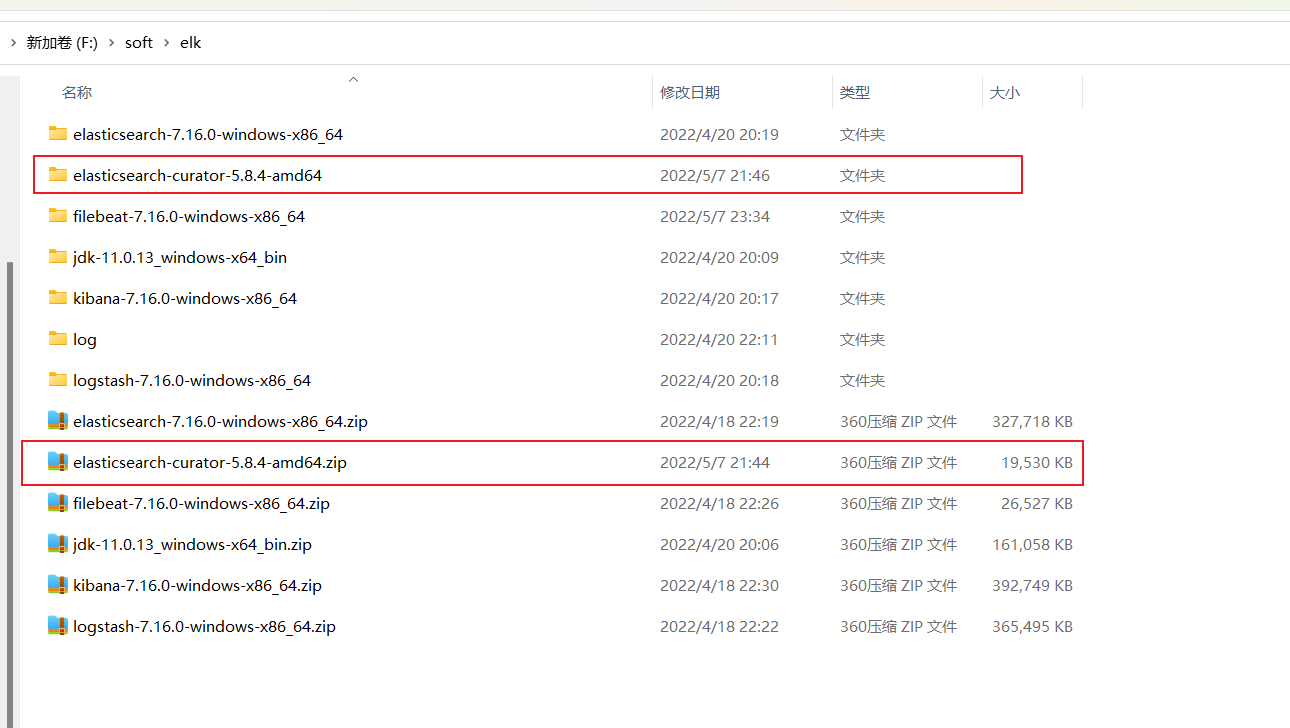
解压
搜索系统变量
点击环境变量
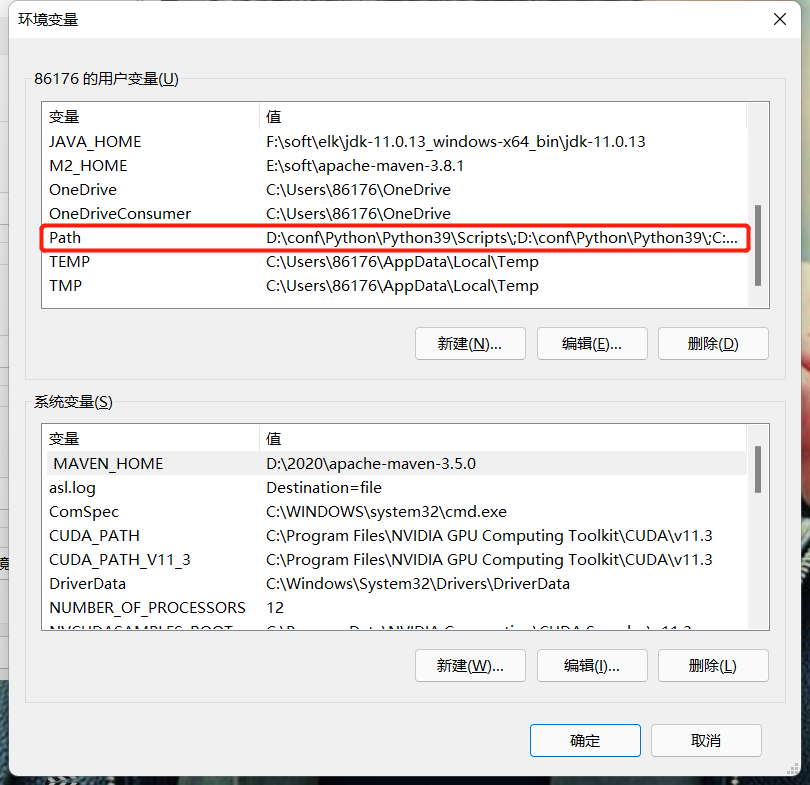
双击Path
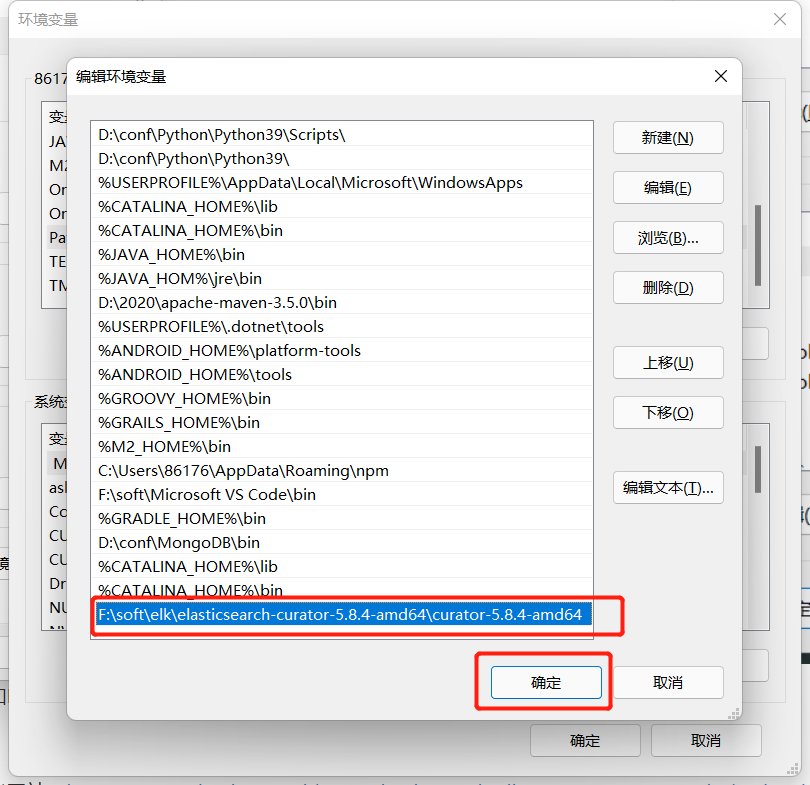
添加F:\soft\elk\elasticsearch-curator-5.8.4-amd64\curator-5.8.4-amd64
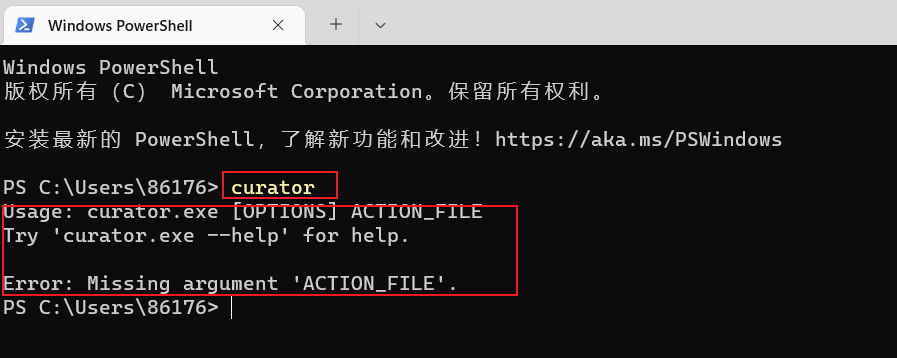
按键Win+X打开新的shell
输入命令curator可以看到已经执行成功
配置curator配置文件
参考网站:https://www.elastic.co/guide/en/elasticsearch/client/curator/current/index.html
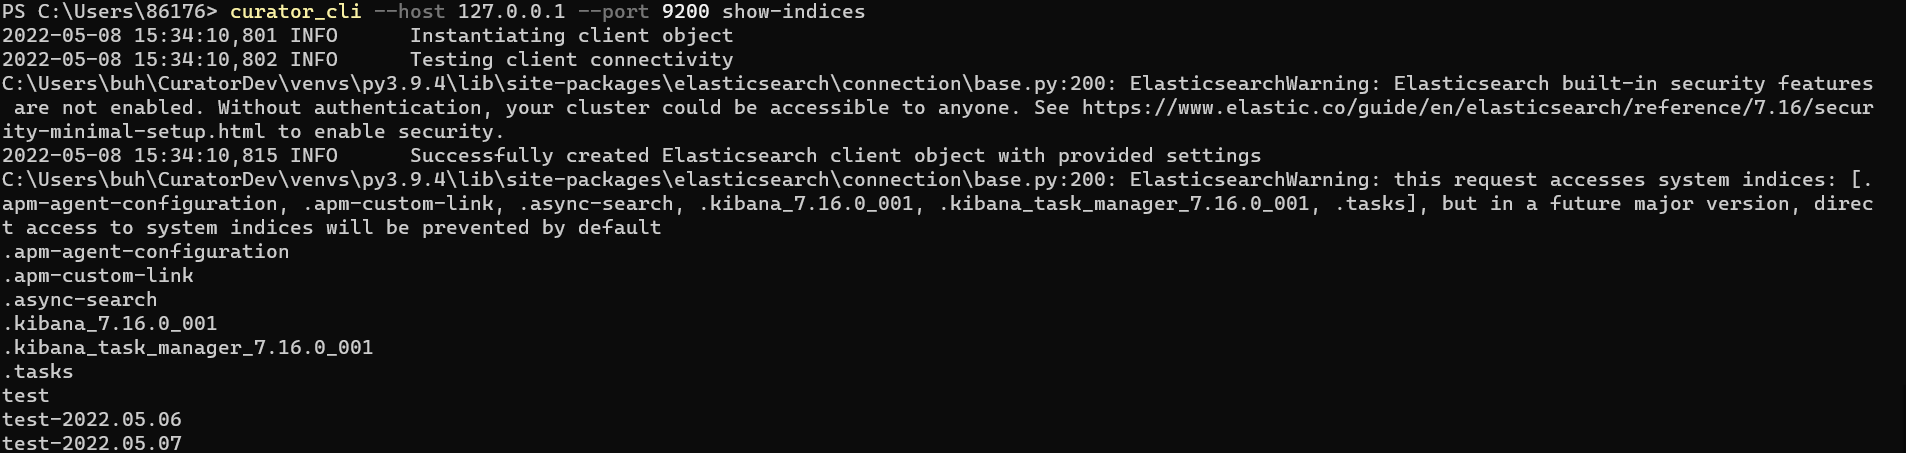
输入命令查看本地es创建的索引
1 | curator_cli --host 127.0.0.1 --port 9200 show-indices |
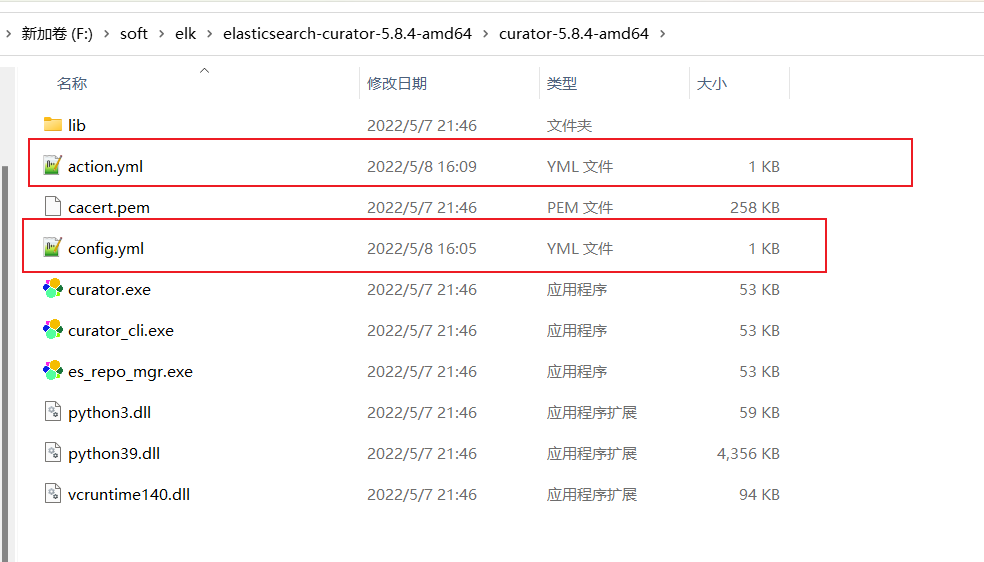
在路径下F:\soft\elk\elasticsearch-curator-5.8.4-amd64\curator-5.8.4-amd64
新建action.yml和config.yml文件
config.yml内容如下:
1 | client: |
action.yml内容如下:
unit_count为1,表示删除1天前的以test-为开头命令的索引
1 | # Remember, leave a key empty if there is no value. None will be a string, |
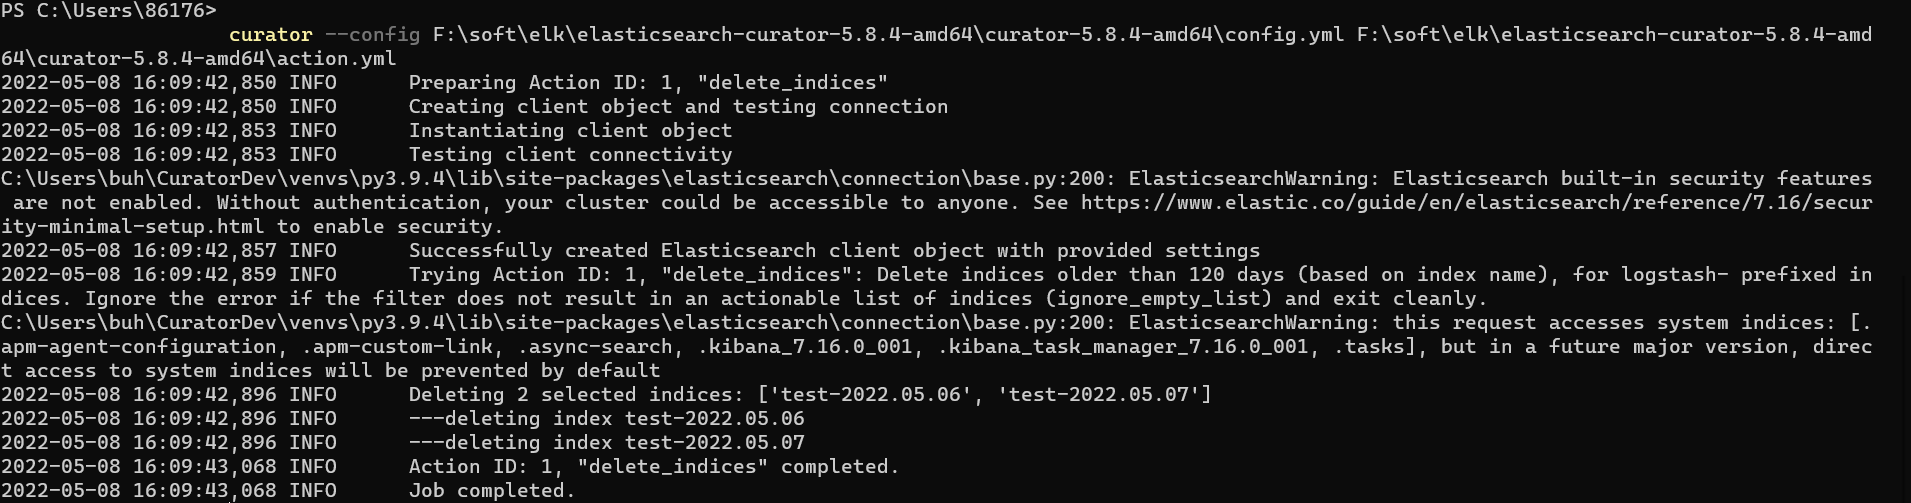
输入如下命令
1 | curator --config F:\soft\elk\elasticsearch-curator-5.8.4-amd64\curator-5.8.4-amd64\config.yml F:\soft\elk\elasticsearch-curator-5.8.4-amd64\curator-5.8.4-amd64\action.yml |
可以看到5月6号和5月7号的索引被成功删除
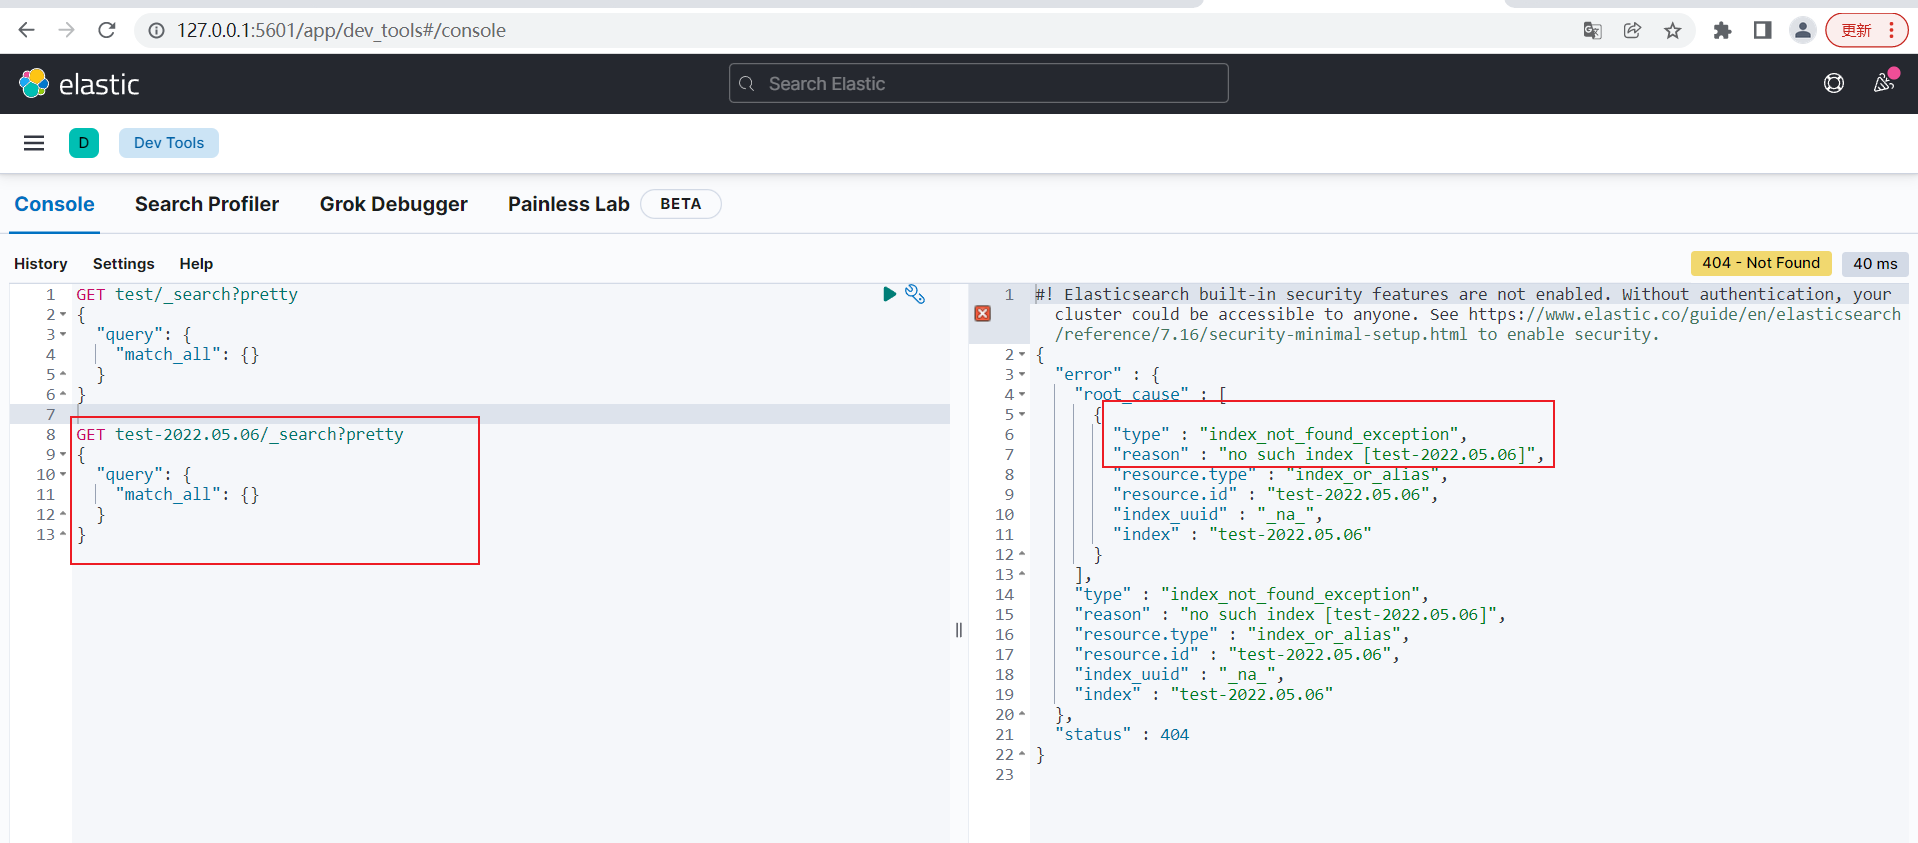
通过kibana索引查询,发现索引已经不存在了
1 | GET test-2022.05.06/_search?pretty |
创建定时任务清理任务
linux 系统中我们可以将命令添加到定时任务中执行
1 | crontab -e |
过滤日志
结论
可以看到一个简单的日志收集系统搭建成功,我们可以根据这套系统收集日志,并做分析,本文只是针对window版本的介绍,后续会在linux版本搭建一套,步骤基本一致,更多实用搜索功能敬请期待。